Figure 3.


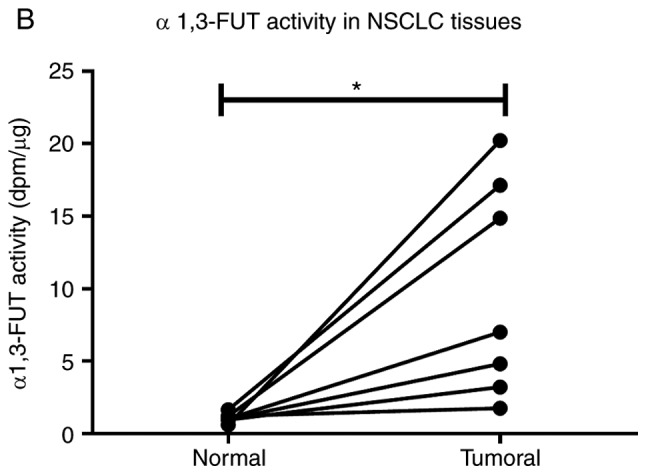
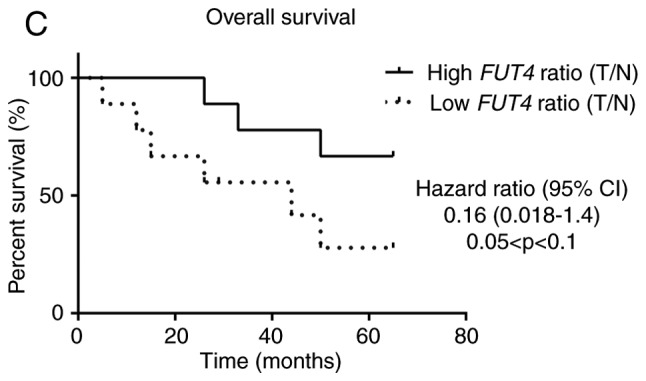
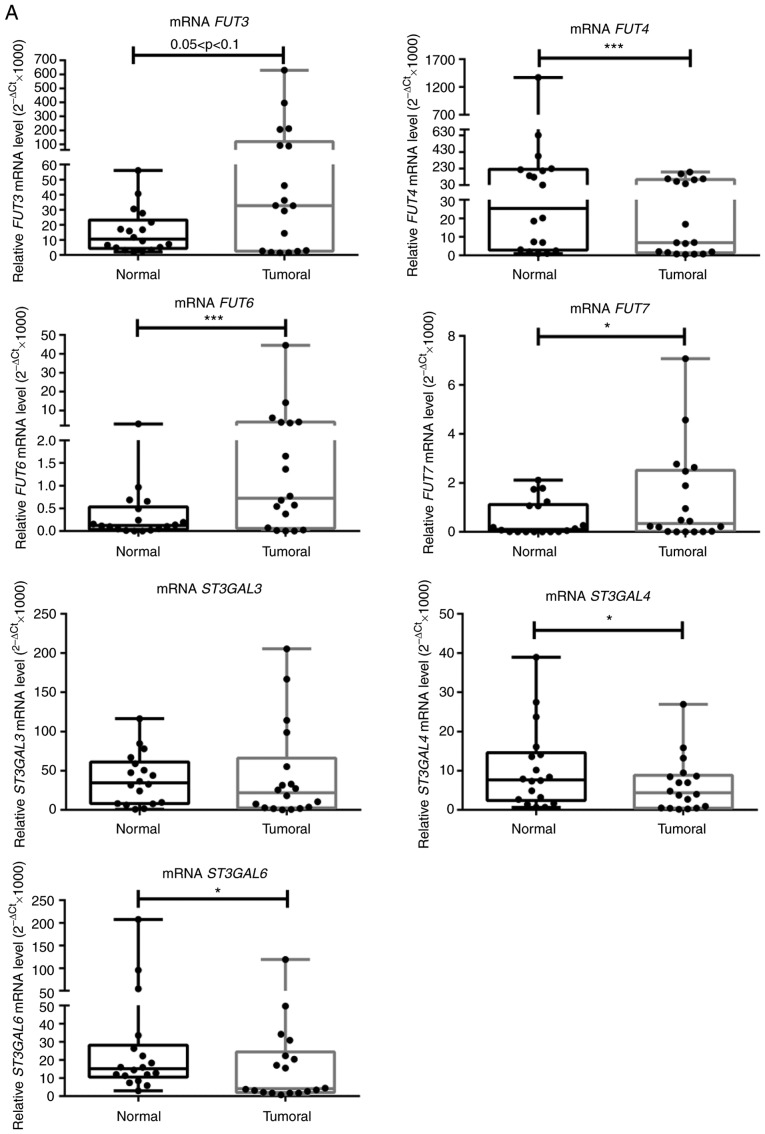
NSCLC tissues show upregulation of FUT3, FUT6 and FUT7 and increased α1,3-FUT activity. (A) Relative mRNA levels of FUT3, FUT4, FUT6, FUT7, ST3GAL3, ST3GAL4 and ST3GAL6 in normal and tumour tissues from patients with NSCLC, as determined via reverse transcription-quantitative PCR analysis. Values indicate the number of mRNA molecules of a certain gene per 1,000 molecules of the average of the endogenous controls (ACTB and GAPDH). Box-and-whisker plots represent median values, and lower and upper quartiles (boxes), ranges and all values for each group (black dots). *P<0.05, ***P<0.001. 0.05<P<0.1, marginally significant. NSCLC tissues show upregulation of FUT3, FUT6 and FUT7 and increased α1,3-FUT activity. (B) Evaluation of α1,3-FUT activity in tissue lysates. α1,3-FUT enzymatic activity was evaluated in lysates obtained from normal and NSCLC tissues derived from 7 patients. Activity was measured using fetuin as an acceptor. 0.05<P<0.1, marginally significant; *P<0.05. (C) Relationship between overall survival and FUT4 expression ratio. Curve plots of overall survival in 18 patients (vertical tick marks indicate censored cases). Patients with high FUT4 T/N ratios (n=9) and patients with low FUT4 T/N ratios (n=9) were separated based on the median value. The multivariate survival model used was the Cox proportional hazards model. 0.05<P<0.1, marginally significant. FUT, fucosyltransferase; NSCLC, non-small cell lung cancer; ST3GAL, α2,3-sialyltransferase; T/N, tumour/normal.

