Abstract
Seizures, status epilepticus, and seizure-like rhythmic or periodic activities are common, pathological, harmful states of brain electrical activity seen in the electroencephalogram (EEG) of patients during critical medical illnesses or acute brain injury. Accumulating evidence shows that these states, when prolonged, cause neurological injury. In this study we developed a valid method to automatically discover a small number of homogeneous pattern clusters, to facilitate efficient interactive labelling by EEG experts. 592 time domain and spectral features were extracted from continuous EEG (cEEG) data of 369 ICU (intensive care unit) patients. For each patient, feature dimensionality was reduced using principal component analysis (PCA), retaining 95% of the variance. K-medoids clustering was applied to learn a local dictionary from each patient, consisting of k=100 exemplars/words. Changepoint detection (CPD) was utilized to break each EEG into segments. A bag-of-words (BoW) representation was computed for each segment, specifically, a normalized histogram of the words found within each segment. Segments were further clustered using the BoW histograms by Affinity Propagation (AP) using a χ2 distance to measure similarities between histograms. The resulting 30 50 clusters for each patient were scored by EEG experts through labeling only the cluster medoids. Embedding methods t-SNE (t-distributed stochastic neighbor embedding) and PCA were used to provide a 2D representation for visualization and exploration of the data. Our results illustrate that it takes approximately 3 minutes to annotate 24 hours of cEEG by experts, which is at least 60 times faster than unaided manual review.
Keywords: EEG, critical care, ictcal-interictal continuum, clustering, unsupervised learning
I. Introduction
In contemporary medicine, it is increasingly recognized that a significant fraction of critically ill patients in the intensive care unit (ICU) have nonconvulsive seizures (NCS): seizures with little or no clinical manifestations [1], [2]. NCS can cause neuronal injury or worsen existing injury, and are related to poor neurologic outcomes for patients.
Besides seizures, seizure-like patterns are frequently observed in ICU patient EEGs, known as “interictal-ictal continuum” (IIC) patterns. These IIC patterns are associated with increased risk of seizures and poor outcome in critically ill patients [3]. According to American Clinical Neurophysiology Society (ACNS) standardized terminology [4], IIC patterns are a group of rhythmic and periodic EEG patterns, including “Periodic Discharges”(PD), and “Rhythmic Delta Activity”(RDA). IIC patterns can be further categorized as “Lateralized”(L) or “Generalized”(G) based on whether the patterns present in a single (L) or in both (G) hemispheres.
IIC patterns are associated with an increased risk of seizures [3]. PD and frequent NCS are an independent risk factor for worse prognosis [5]. In current clinical practice, it is up to clinicians to weigh the risk that a given EEG pattern is harmful against the risk and side effects associated with available treatments. In order to create a more objective approach, the relationships between the presence, frequency and duration of NCS and IIC patterns need to be studied systematically.
It is fairly hard to capture NCS or IIC in routine EEG, since these recordings only typically last 20 to 30 minutes. Prolonged continuous EEG monitoring (cEEG) is therefore important for detecting NCS and IIC patterns. However, it is a complex and time-consuming task for the electroen-cephalographer to interpret the large amount of data in cEEG. Therefore, the first essential step towards this systematic study is to automate the analysis of the cEEG.
Some earlier studies tried to break the EEG into segments by detecting event boundaries, i.e., moments where the pattern changes [6], [7]. Afterward the EEG segments were clustered based on features extracted from each segment. The resulting clusters were, however, not related to a specific EEG pattern. More recent studies have tried to automatically classify preset segments in fixed duration of EEG data [8], [9]. However, the analysis was either carried out on too limited a number of pattern types [8], or was for scoring the entire EEG based on combined predetermined thresholds for each segment [9].
In this study, we aimed to apply unsupervised machine learning methods to achieve efficient pre-clustering of NCS and IIC patterns in prolonged cEEG recordings into a small number of clusters. This method facilitates efficient interactive labelling of prolonged EEG recordings by experts. Our results suggest that cEEG recordings can be rapidly annotated by experts at least 60 times faster than unaided manual review.
II. Materials and Methods
A. EEG Samples
In this study, we analyzed data from 369 ICU patients admitted at MGH between 2012 to 2017. The first 24 hours of each cEEG recording for each patient was converted to longitudinal bipolar montage and re-sampled to 200Hz. Digital bandpass filtering between 0.5Hz to 40Hz was applied to de-noise the data before further analysis.
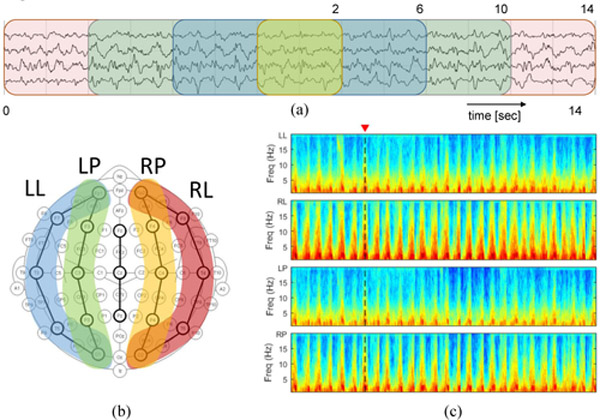
To include contextual information of the surrounding EEG at various scales, we computed the same features (see below) within windows of 4 different lengths, centered on the 2 second central interval to which we wish to ultimately attach a label (see Fig. 1a). In addition, as shown in Fig. 1b and c, regional average spectrograms (LL:Left Lateral, RL:Rigth Lateral, LP:Left Parasagittal, and RP:Right Parasagittal) were computed to include both spectral and spatial domain knowledge before feature extraction.
Fig. 1.
Comprehensive EEG knowledge from (a) temporal, (b) spatial, and (c) spectral domains.
As can be seen in Table I, for each spatial location and temporal scale, we extracted a variety of features that describe each 2 second EEG interval; features included classic measures such as line length, kurtosis, entropy, nonlinear energy operator activation, relative power, power ratios, and power kurtosis. Accounting for all 4 spatial regions, all 4 temporal scales, and the 37 different spectral and temporal features, we extracted 37×4×4=592 features to describe each 2 second EEG interval. This rich set of features is intended to suffice for differentiating all patterns encountered in NCS and IIC events in cEEGs from ICU patients. Principal component analysis (PCA), with 95% variance retained, reduced the dimensionality for each feature array.
TABLE I.
EEG Features.
| Temporal Features | Feature Calculation |
|---|---|
| Line length | |
| Kurtosis | |
| Shannon entropy | Absolute value |
| Nonlinear energy operator | Mean and SD |
| Spectral Features | |
| δ, θ, α, and β Kurtosis | |
| Relative δ, θ, α, and β power | Mean, min, SD, the 95th percentil |
| δ/θ, δ/α, and θ/α ratios | Mean, min, SD, the 95th percentil |
B. CPD-BoW based Unsupervised Clustering
Changepoint Detection:
A changepoint is a time instant at which some statistical property of a signal changes abruptly. Changepoint detection (CPD) [10], [11] is a general method to find abrupt changes in time series. The property in question can be the mean of the signal, its variance, or a spectral characteristic, among others. For changepoint detection we employed a parametric global method, implemented in the MATLAB (Natick, MA) Signal Processing Toolbox.
The CPD algorithm chooses a point and divides the signal into two sections. Then it computes an empirical estimate of the desired statistical property for each section. At each point within a section, CPD measures how much the property deviates from the empirical estimate, and adds the deviations for all points. After that, the algorithm adds the deviations section-to-section to find the total residual error.
In addition, it varies the location of the division point until the total residual error attains a minimum. In this study, the chosen statistic is the mean of the total power of EEG. In this case, CPD minimizes the total residual error from the best horizontal level for each section. Given a signal x1, x2, ⋯, xN, if there are K changepoints to find, then the objective function to minimize is given by:
| (1) |
where k1, ⋯, kK are the indices of K changepoints, with k0 and kK+1 defined as the first and last samples in the signal respectively. Moreover, stands for the mean operator, βK represents the penalty term added to avoid overfitting, with β=10 (chosen empirically) the penalty constant.
CPD rejects adding additional changepoints if the reduction in residual error does not meet the threshold. To perform the minimization, CPD leverages on a recursive optimization algorithm based on dynamic programming with early abandonment [12].
BoW-based Clustering:
A bag-of-words (BoW) model (also known as a “term-frequency counter”) [13] records the number of times that words appear in each document of a collection. In this study, we consider EEG recordings as a special type of “text”, with pattern vectors extracted for each consecutive 2 second EEG interval as the elementary “words”. For each patient, we learn a dictionary of words consisting of the most representative EEG intervals or exemplars. Those exemplars are identified as the cluster medoids by unsupervised k-medoids clustering with k=100 (chosen empirically) on the reduced feature space after applying PCA (see Fig.3).
Fig. 3.
Learn a local dictionary of 100 words from reduced feature space.
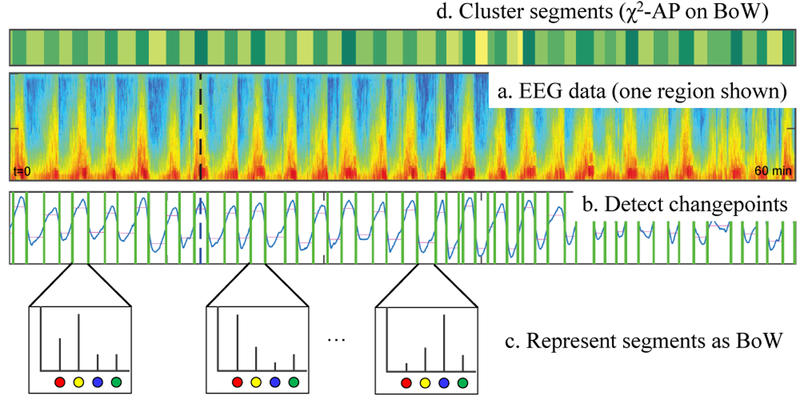
As shown in Fig.2b, the CPD algorithm breaks EEG into segments that are relatively homogeneous between change-points (green lines). We align each changepoint to the onset of its nearest 2-second EEG interval to resolve boundary issues. First we map the feature vector associated with each 2 second EEG interval to one of 100 words. As a result, each segment obtained from CPD is represented as a sequence of words (“sentence”). For each such sequence, we calculate the histogram of words (a.k.a. “Bag of Words” or BoW in short). At last, we cluster the EEG segments based on their corresponding word histograms by applying χ2-based Affinity Propagation (AP) [14].
Fig. 2.
CPD-BoW based unsupervised clustering model.
From our experiments, the proposed CPD-BoW model typically identifies 30–50 clusters for each 24 hours of EEG recording. To facilitate rapid annotation, instead of labelling each consecutive intervals in a brute force way, the idea is to label only those 30–50 cluster medoids, and share the label to every member segments within each cluster.
C. Rapid Seizure and IIC Annotation
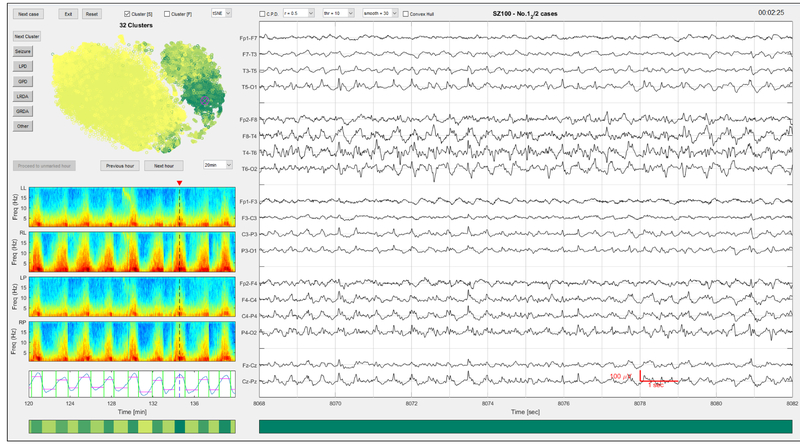
As shown in Fig.4, a MATLAB-based graphical user interface (GUI) was developed to enable interactive rapid labelling by EEG experts. The idea is to label the cluster medoids, then apply the label given to the medoid to all segments belonging to the same cluster. The different EEG patterns that we aimed to distinguish were “Seizure”, and the most common IIC patterns “LPD”, “GPD”, “LRDA” and “GRDA”. An “Other” class was added as well to cover any other conditions such as baseline/background EEG, and artifacts.
Fig. 4.
The graphical user interface for rapid annotation.
In our GUI, 14 seconds of EEG from 24 hours recording is shown at a time in the window on the right, displayed in groups of electrodes from the left and right lateral (LL, RL), left and right parasagittal (LP, RP), and central regions. The regional average (LL, RL, LP, RP) spectrograms containing this EEG time point (as marked by the dash lines) are displayed on the left, with the changepoint detection results at the bottom. The unsupervised clustering membership assignment is illustrated by the horizontal color bar below the CPD panel, as determined by the CPD-BoW-AP steps. The colors given in the horizontal bar are assigned based on the average total power from all members in that cluster. The higher the power values (usually correlates with severity of the EEG patterns), the darker the color is.
Above the spectrograms is a 2D embedding map computed using t-SNE [15] for data visualization and exploration. Each scattered point in this map corresponds to a 596-dimensional feature vector extracted from a 2 second EEG interval. The embedding map retains the intrinsic structure/relationship of samples in feature space; points that are close to each other in this embedding map are very likely to be similar patterns in feature space.
III. Experiments and results
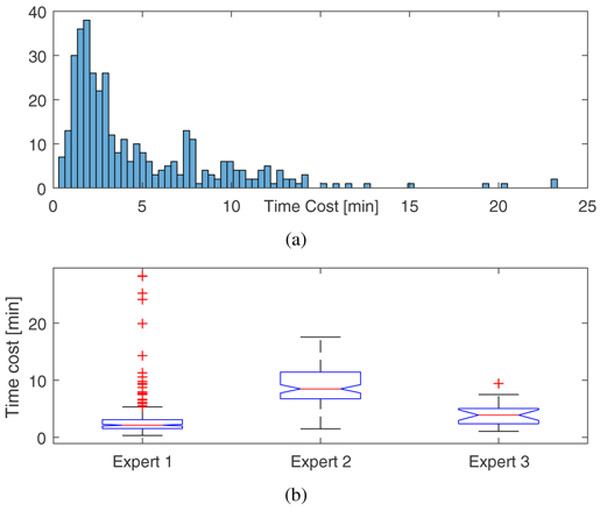
We investigated whether the labeling of prolonged cEEG could be done with minimal effort, and assessed how fast the proposed method could facilitate annotation. We have carried out annotation tasks in which 3 EEG experts applied the proposed GUI to label 369 cEEG recordings (more precisely, the first 24 hours of each recording). Results of the annotation experiments are shown in Fig. 5, and Table II.
Fig. 5.
Validation on rapid annotation using the proposed method: (a) the overall histogram of time, and (b) the boxplots of time for each expert.
TABLE II.
Annotation experiment on time cost (in minutes).
| N | Mean±std | Range | Median | IQR | |
|---|---|---|---|---|---|
| Expert 1 | 249 | 3.13±3.74 | 0.32-28.25 | 2.13 | 1.55-3.08 |
| Expert 2 | 100 | 8.87±3.30 | 1.50-17.55 | 8.49 | 6.74-11.42 |
| Expert 3 | 20 | 3.95±2.14 | 1.05-9.43 | 3.90 | 2.39-5.05 |
| Overall | 369 | 4.73±4.36 | 0.32-28.25 | 2.97 | 1.81-6.28 |
N: the number of cEEG recordings labeled by each expert
IQR: inter quartile range
As can be seen in Table II, the median time taken by the 3 experts to label 24 hours of EEG data ranges from 2–9 minutes, with an overall median time of approximately 3 minutes. In comparison, conventional review consists of serially reviewing 10–15 second EEG intervals of the 24 hours of EEG, which requires visual inspection of between 5,760–8,640 individual intervals. Annotating 24 hours of EEG at a temporal resolution of one label per 2 seconds, which is the resolution obtained by the proposed annotation scheme, requires applying 43,200 labels per EEG. In practice, some time saving is often possible by “drawing boxes” around events of interest and labeling the entire events at once. Nevertheless, even done this way, manual annotation generally takes 2–4 hours per 24 hours of EEG (unpublished observations of author MBW), and is thus not scalable. Using 3 hours as a conservative lower bound for unaided manual annotation, we estimate that our method provides a speedup of at least 60 times.
IV. Conclusion
This research supports the idea that cEEG data can be validly clustered into a small number of distinct patterns. Our results suggest that long EEG recordings can be rapidly annotated by experts at least 60 times faster than unaided manual review. Using our system we are currently in the process of labeling >30TB of EEG data from 2,000 ICU subjects. We are also conducting the inter-rater study to evaluate the clustering performance. The resulting EEG data will provide sufficient data to train deep neural network models to automatically detect NCS and IIC patterns. This rich data will also allow us to gain a deeper understanding of the clinical consequences of NCS and IIC events, and how the consequences depend on the attributes of different NCs and IIC patterns.
References
- [1].Claassen J, Mayer S, Kowalski R, Emerson R, and Hirsch L, “Detection of electrographic seizures with continuous EEG monitoring in critically ill patients,” Neurology, vol. 62, no. 10, pp. 1743–1748, 2004. [DOI] [PubMed] [Google Scholar]
- [2].Hirsch LJ, “Continuous EEG monitoring in the intensive care unit: an overview,” Journal of clinical neurophysiology, vol. 21, no. 5, pp. 332–340, 2004. [PubMed] [Google Scholar]
- [3].Gaspard N, Hirsch LJ, LaRoche SM, Hahn CD, and Westover MB, “Interrater agreement for critical care EEG terminology,” Epilepsia, vol. 55, no. 9, pp. 1366–1373, 2014. [DOI] [PMC free article] [PubMed] [Google Scholar]
- [4].Hirsch L, LaRoche S, Gaspard N, Gerard E, Svoronos A, Herman S, Mani R, Arif H, Jette N, Minazad Y, et al. , “American clinical neurophysiology societys standardized critical care EEG terminology: 2012 version,” Journal of clinical neurophysiology, vol. 30, no. 1, pp. 1–27, 2013. [DOI] [PubMed] [Google Scholar]
- [5].Varelas PN and Claassen J, Seizures in critical care: a guide to diagnosis and therapeutics. Springer, 2017. [Google Scholar]
- [6].Bodenstein G and Praetorius HM, “Feature extraction from the electroencephalogram by adaptive segmentation,” Proceedings of the IEEE, vol. 65, no. 5, pp. 642–652, 1977. [Google Scholar]
- [7].Agarwal R, Gotman J, Flanagan D, and Rosenblatt B, “Automatic eeg analysis during long-term monitoring in the ICU,” Electroencephalography and clinical Neurophysiology, vol. 107, no. 1, pp. 44–58, 1998. [DOI] [PubMed] [Google Scholar]
- [8].Cloostermans MC, de Vos CC, and van Putten MJ, “A novel approach for computer assisted eeg monitoring in the adult ICU,” Clinical neurophysiology, vol. 122, no. 10, pp. 2100–2109, 2011. [DOI] [PubMed] [Google Scholar]
- [9].Lodder SS and van Putten MJ, “Quantification of the adult EEG background pattern,” Clinical neurophysiology, vol. 124, no. 2, pp. 228–237, 2013. [DOI] [PubMed] [Google Scholar]
- [10].Guralnik V and Srivastava J, “Event detection from time series data,” in Proceedings of the fifth ACM SIGKDD international conference on Knowledge discovery and data mining, pp. 33–42, ACM, 1999. [Google Scholar]
- [11].Lund R, Wang XL, Lu QQ, Reeves J, Gallagher C, and Feng Y, “Changepoint detection in periodic and autocorrelated time series,” Journal of Climate, vol. 20, no. 20, pp. 5178–5190, 2007. [Google Scholar]
- [12].Killick R, Fearnhead P, and Eckley IA, “Optimal detection of changepoints with a linear computational cost,” Journal of the American Statistical Association, vol. 107, no. 500, pp. 1590–1598, 2012. [Google Scholar]
- [13].Zhang Y, Jin R, and Zhou Z-H, “Understanding bag-of-words model: a statistical framework,” International Journal of Machine Learning and Cybernetics, vol. 1, no. 1-4, pp. 43–52, 2010. [Google Scholar]
- [14].Dueck D and Frey BJ, “Non-metric affinity propagation for unsupervised image categorization,” in Computer Vision, 2007. ICCV 2007. IEEE 11th International Conference on, pp. 1–8, IEEE, 2007. [Google Scholar]
- [15].Maaten L. v. d. and Hinton G, “Visualizing data using t-SNE,” Journal of machine learning research, vol. 9, no. Nov, pp. 2579–2605, 2008. [Google Scholar]


