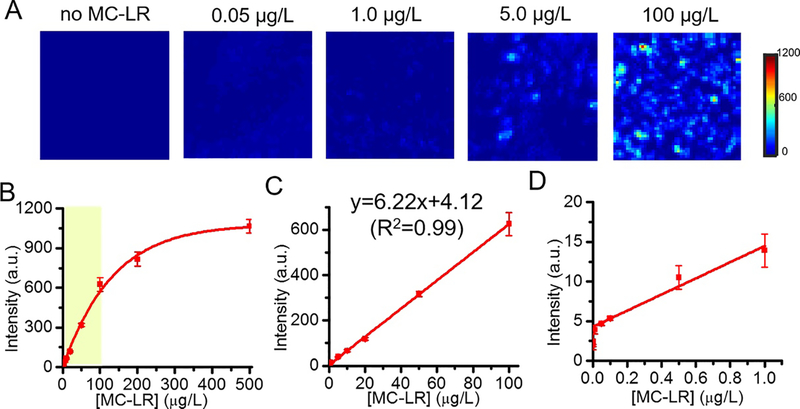
Figure 3. Quantification of MC-LR using the developed SERS immunosensor.
(A) Representative SERS images constructed using the 1342 cm−1 peak intensity from the SERS immunoassay (Field of view: 80×80 μm2) at different MC-LR concentrations (0, 0.05, 1.0, 5.0 and 100 μg/L). (B) The plot of the SERS intensity at 1342 cm−1 as a function of the MC-LR concentration. (C,D) The zoom-in versions of the linear regions of concentration-SERS intensity curve in (B). Experiments were performed in triplicates, and the error bars at each concentration of MC-LR represent the standard deviation of the SERS intensity from three independent experiments.

