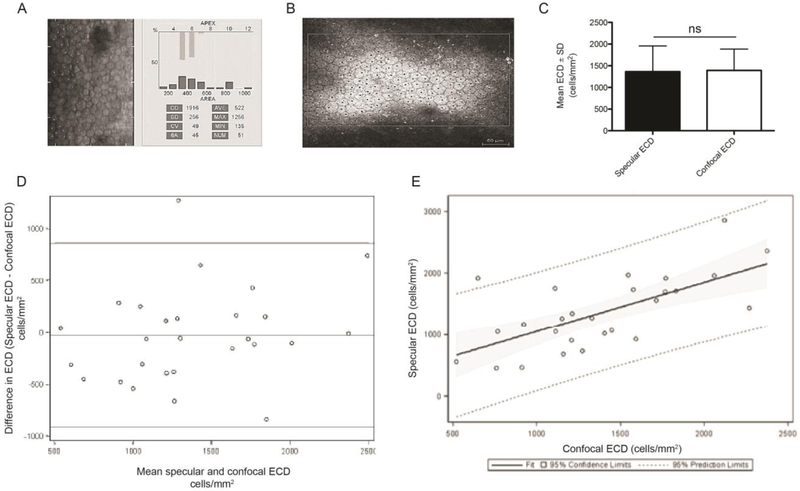
Figure 1. Non-contact specular microscopy and confocal microscopy to image the corneal endothelium.
Manual cell counts using point and click method to achieve mean endothelial cell density (ECD) on (A) specular and (B) confocal images. Specular NAVIS computer software (A) used to calculate ECD on the specular microscope. The outside margin (B) denotes the region of interest (ROI), with dots marking each whole cell that was counted. (C) The bar graph represents mean ECD (cells/mm2) obtained by specular and confocal imaging techniques of subjects with both specular and confocal high quality images (n=23 subjects). Paired two-tailed Student’s t=test; ns= no significance. (D) Bland Altman and (E) fit plot analyses for mean specular and confocal ECD measurements (n=23 subjects). Data are expressed as mean ± SEM. The upper and lower horizontal lines (862.59, −918.07) represented 95% confidence intervals, where 95% of the differences between the two methods fell. The upper and lower horizontal lines were ± 1.96 standard deviations from the mean. The middle horizontal line represented the mean difference between the two methods of measurement (the ‘bias’). SD=standard deviation.

