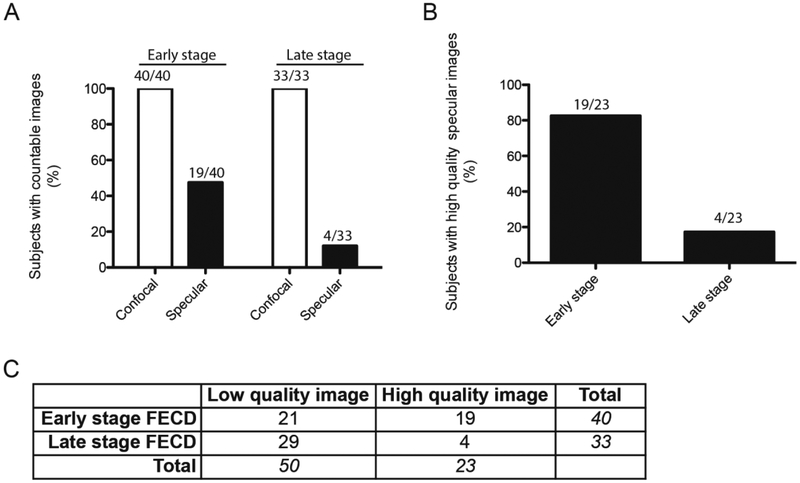
Figure 2. Association between clinical stage of FECD and quality of image.
(A) Bar graph showing percentage of subjects with countable images broken down by stage of disease and imaging technique. (B) Bar graph representation of subjects with high quality specular images. (C) Table showing number of low and high quality specular images by stage of FECD. McNemar Test (χ2; p=0.0012). FECD= Fuchs endothelial corneal dystrophy.

