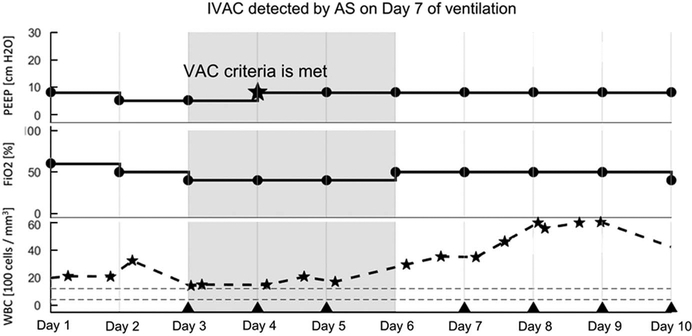
FIGURE 4.
Visualization of ventilator-associated event (VAE) detection and classification by automated surveillance. The grey band highlights the start and end of the VAE window as specified by the NHSN VAC criterion. The example shown is an IVAC: There is an increase in PEEP after 2 days of stability (from 5 to 8; marked by a star), WBC counts are abnormally elevated (indicated by stars), and a new qualifying antimicrobial agent is started within an appropriate period and continued for ≥ 4 calendar days. Days of administration are indicated by triangle markers.

