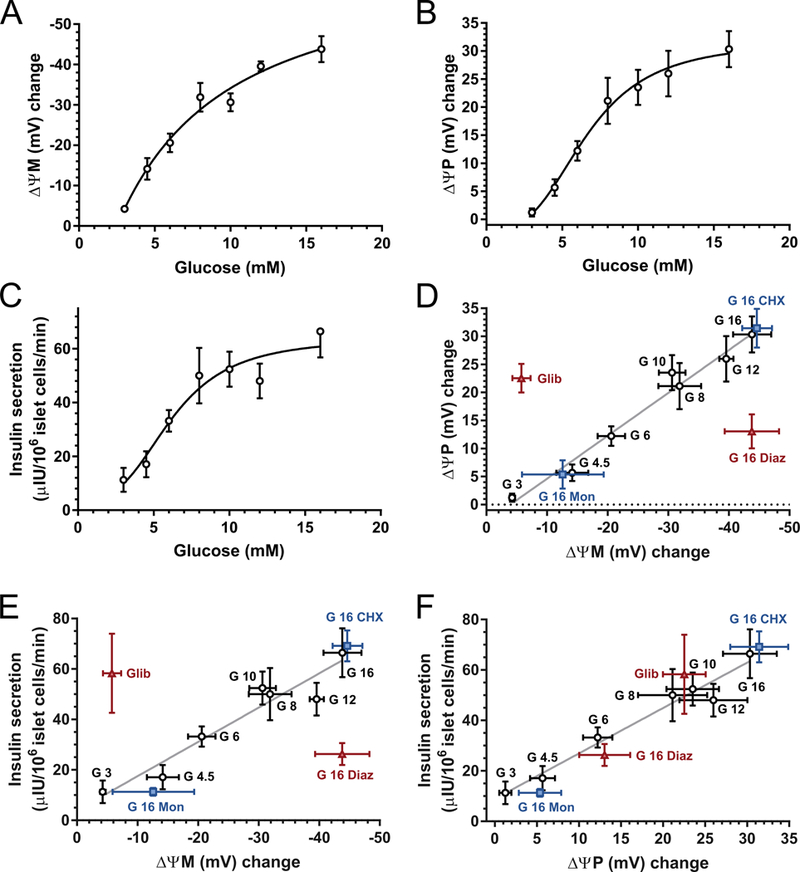
Fig. 2.

Glucose concentration dependence of ΔψM, ΔψP and insulin secretion. (A-C) Average ΔψM, ΔψP and insulin secretion were measured during a 30-min period after elevation of glucose from the basal 3 mM to the indicated level, corresponding to the horizontal bars shown at the top of Fig. 1C-D. Potentials are given as the change compared to the average of the 30-min baseline at 3 mM glucose. Corresponding absolute values are shown in Table 1. Insulin release into the assay medium was measured in the same time period and normalized to the total islet cell count at the end of the time course. (D-F) Pairwise correlation analysis of ΔψM, ΔψP and insulin secretion. Black circles correspond to A-C. Glib, glibenclamide (1 μM) was given in the presence of 3 mM glucose. Diaz, diazoxide (50 μM); Mon, monensin (1 μM); and CHX, cycloheximide (35 μM) were given with 16 mM glucose. These recordings followed identical timing to the glucose titration. Data are mean±SE of n=4 individuals.
