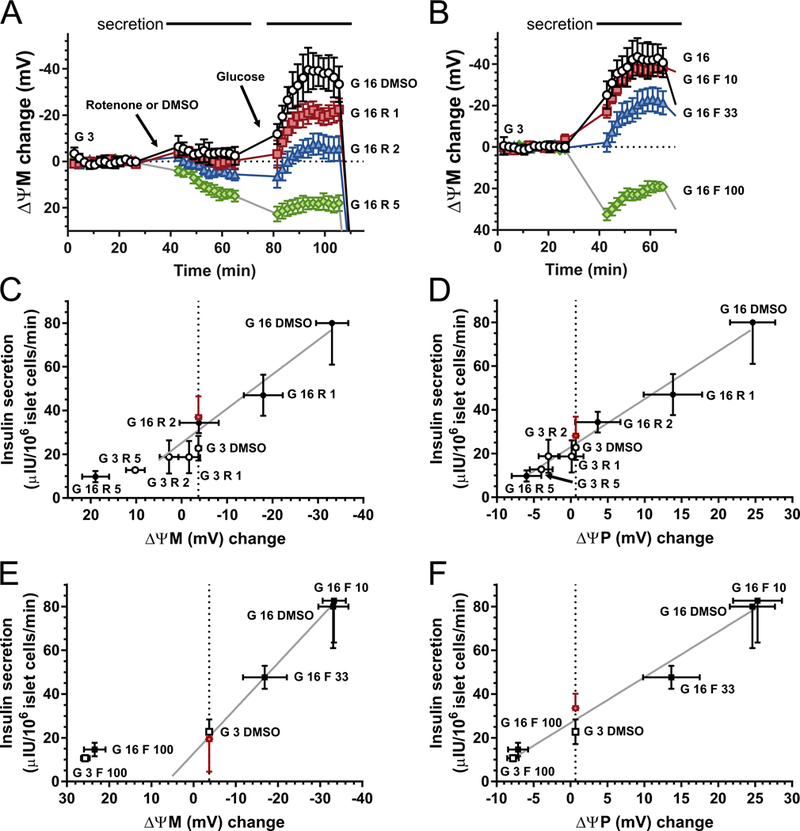
Fig. 3.

ΔψM predicts glucose-stimulated insulin secretion. (A-B) Time courses of ΔψM in β-cells stimulated with glucose (G in mM) in the presence of rotenone (R in nM) or FCCP (F in nM). Horizontal bars on the top indicate the time intervals where potentials were averaged to match data with secretion measurements. See Table 1 for the absolute millivolt values corresponding to the baseline. (C-D) Effects of increasing concentrations of rotenone on the relationship of ΔψM or ΔψP to insulin secretion, in the presence of 3 mM (open circles) or 16 mM (closed circles) glucose. The red diamond indicates estimated insulin secretion at 16 mM glucose plus rotenone at a potential (vertical dotted line) matching that at 3 mM glucose without inhibitor. The estimated secretion was not different from the vehicle-treated control (“G 3 DMSO”) by paired t-test. E-F) Effects of increasing concentrations of FCCP on the relationship of ΔψM or ΔψP to insulin secretion, in the presence of 3 mM (open squares) or 16 mM (closed squares) glucose. The red diamond indicates estimated insulin secretion at 16 mM glucose plus FCCP at a potential (vertical dotted line) matching that at 3 mM glucose without inhibitor. For ΔψM the highest inhibitor concentrations, which result in ΔψM depolarization, were excluded from the estimation. The estimated secretion was not different from the vehicle-treated control (“G 3 DMSO”) by paired t-test. Estimations were performed for each individual and all shown data are mean±SE of n=4 individuals. Gray trend lines indicate the relationship of secretion and ΔψM or ΔψP at 16-mM glucose and changing inhibitor concentration.
