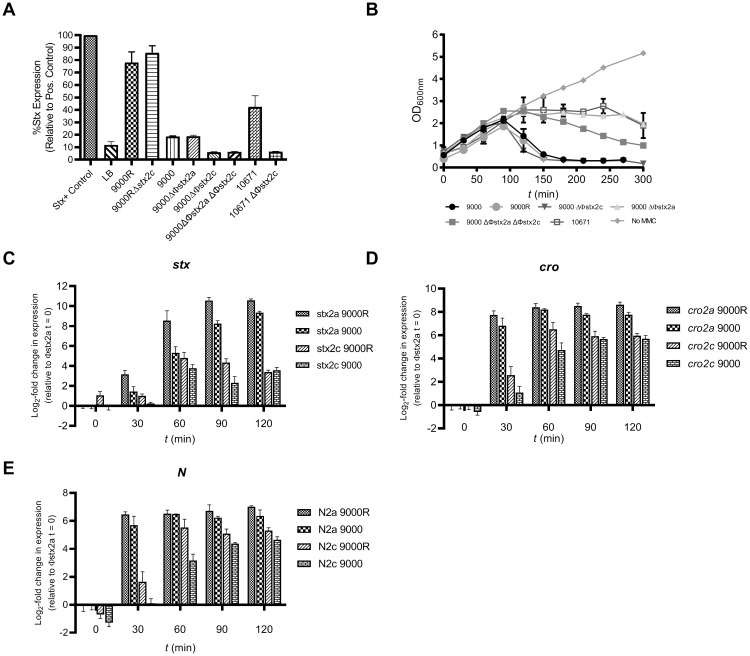
Fig 2. Stx2 toxin production, lysis and Φstx2 gene expression.
(A) Pan Stx2 toxin production from PT21/28 strains 9000, 9000R, PT32 strain 10671 and genetic derivatives was measured by ELISA 24 h post induction with MMC. Values are expressed relative to an inactivated Stx toxin control used in each assay. The mean ± SEM from four biological replicates (n = 4) are shown for each strain. Samples were first diluted either 10−4 or 10−3 to be within the assay limits of detection. LB = Lysogeny Broth without bacteria. (B) Lysis of strains 9000, 9000R, 10671 and genetic derivatives was measured spectrophotometrically as a drop in culture OD600nm. Mean OD600nm values ± SEM from four biological replicates (n = 4) are shown. No MMC = growth of strain 9000 without MMC. Expression of the late gene stx2B (C) and early gene regulators cro (D) and N (E) was monitored from both Φstx2a and Φstx2c in strains 9000 and 9000R after induction with MMC. The mean ± SEM from four biological replicates (n = 4) is shown. Data for stx2, N and cro genes is expressed relative to the Φstx2a encoded analogues (stx2a, N2a, cro2a) at time (t) = 0, respectively.

