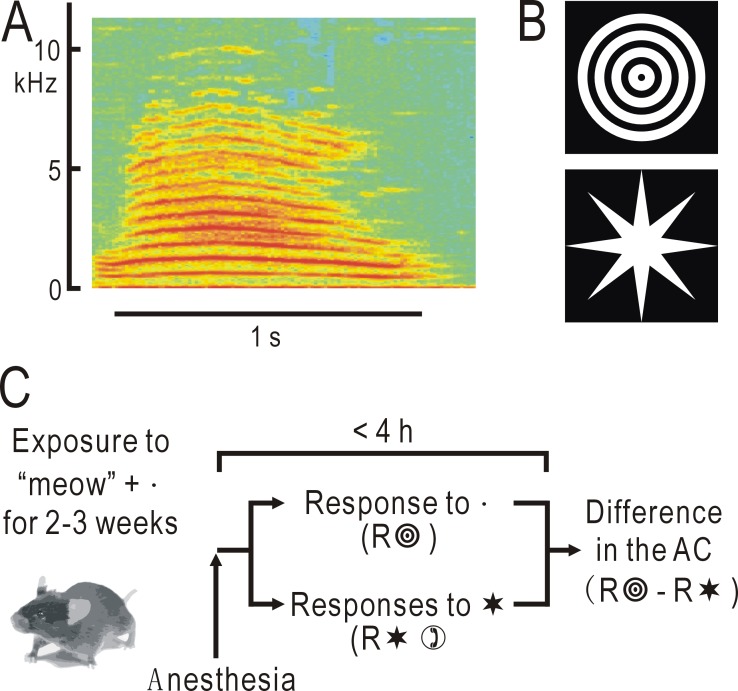
Fig 1. Methods for visualizing associative auditory responses.
(A) Spectrogram of an artificial sound mimicking the sound of a cat’s “meow”. A part of this sound lasting 1 s (horizontal line) was used in the present study. (B) Visual shape stimuli of concentric circles with an angle of view of approximately 20°, or stars. These images were used as test or control shape stimuli. (C) Experimental schedule. Mice were pre-exposed to the test visual shape stimulus synchronized with the “meow” sound, producing an audio-visual associative memory. After the exposure, mice were anesthetized and responses to the test visual stimulus and the other control shape stimulus were recorded in the AC. The difference between the responses was obtained in each mouse and averaged in a group of mice that received the same experimental procedure (n = 12–18 for each group).

