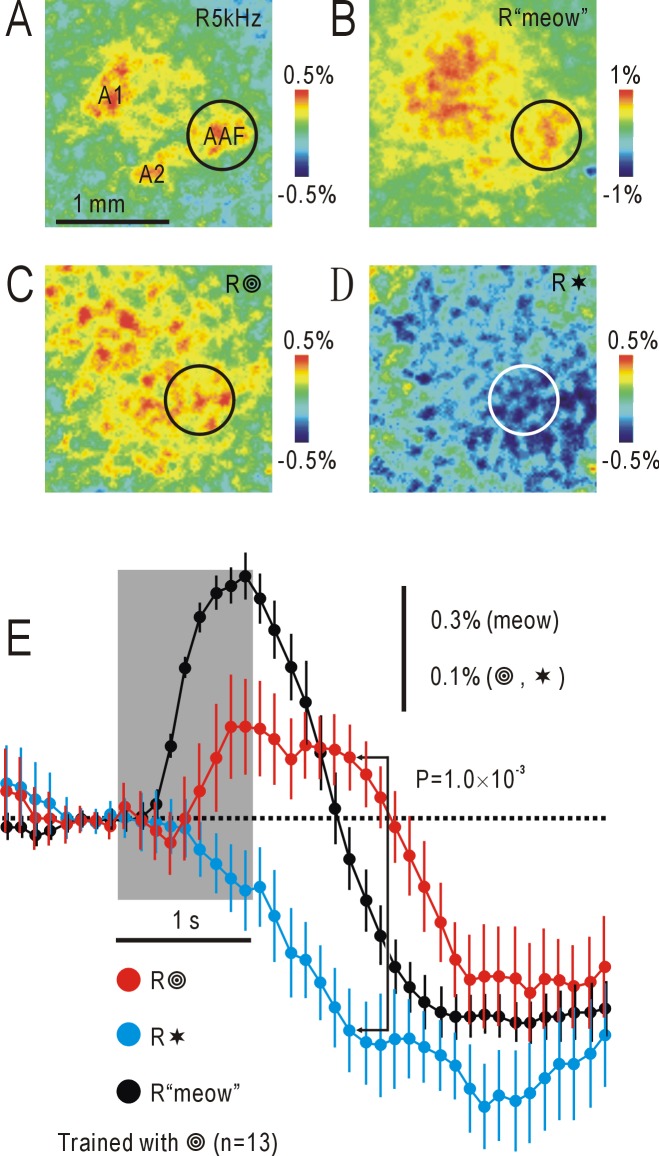
Fig 2. Responses to auditory or visual shape stimuli in the AC.
(A) Image of responses to a pure tone at 5 kHz in the right AC (R5kHz). A1, AAF, and A2 were functionally identified. Circle shows patchy responses in AAF. Upper right corner in the panel corresponds to medial and anterior areas of the cortex. The pseudocolor scale shows ΔF/F0. (B) Responses to a cat’s “meow” sound (R“meow”). The circular ROI shows the location of the characteristic patchy response in AAF. Data shown in (A) and (B) were obtained from the same mouse, and recorded 0.5 and 1 s after stimulus onset, respectively. (C) Responses to concentric circles (test shape stimulus) (R ). Diffuse increases in ΔF/F0 were observed in the AC. (D) Responses to stars (control shape stimulus) (R✶). Diffuse decreases in ΔF/F0 were observed in the AC. Data shown in (C) and (D) were obtained from the same mouse, and recorded 1.8 s after stimulus onset. (E) Time courses of ΔF/F0 within the circular ROI centered on AAF in 13 mice. Dots with lines show means and SEMs. Vertical scale bar: 0.3% for ΔF/F0 in response to the “meow” sound, 0.1% in response to visual shape stimuli. Shaded square shows the timing of stimulus presentation.

