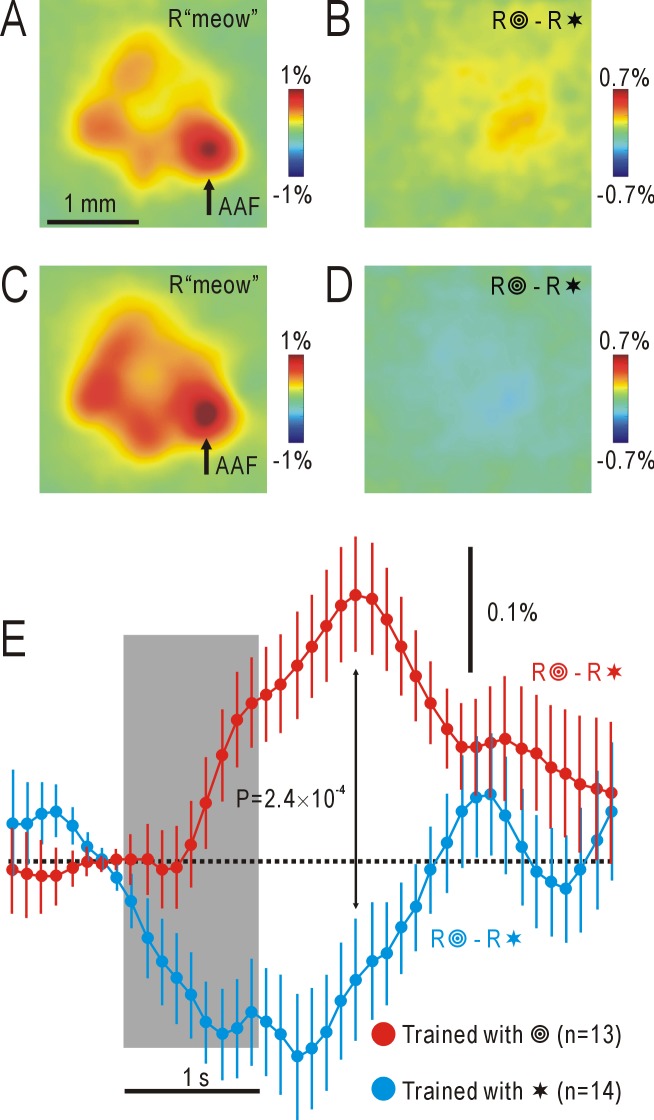
Fig 3. Averaged responses to auditory or visual shape stimuli in the AC.
(A) Averaged responses in the AC to the “meow” stimulus in 13 mice pre-exposed to a combination of the “meow” sound and concentric circles (R“meow”). Arrow shows the position of AAF. The pseudocolor scale shows ΔF/F0. (B) Associative auditory responses calculated as the differential responses to concentric circles (test) and stars (control) in the same 13 mice shown in (A) (R —R✶). Note the responses with positive amplitudes. (C) Averaged responses in the AC to the “meow” stimulus in 14 mice pre-exposed to a combination of the “meow” sound and stars (R“meow”). (D) Associative auditory responses calculated as the differential responses to concentric circles (control) and stars (test) in the same 14 mice shown in (C) (R
 —R✶). Note the responses with negative amplitudes. Data shown in (A) and (C) were recorded 1 s after stimulus onset, and those in (B) and (D) were recorded 1.8 s after stimulus onset. (E) Time courses of ΔF/F0 within the circular ROI centered on AAF in (B) and (D). Dots with lines show means and SEMs.

