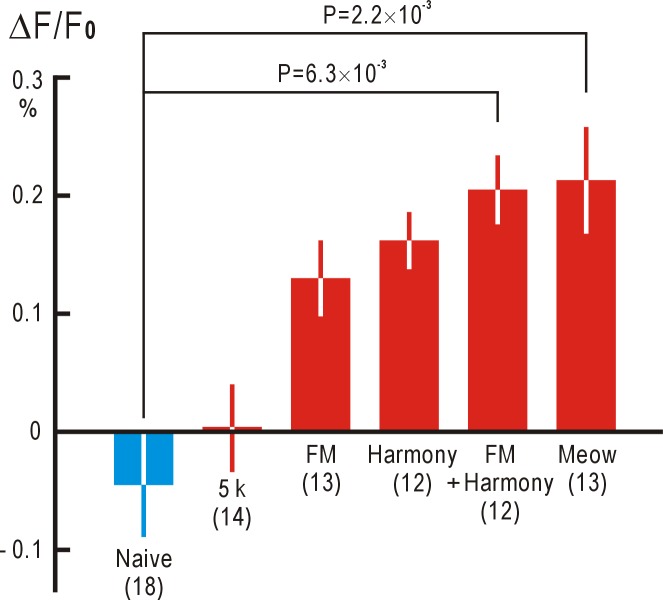
Fig 4. Associative auditory responses in the AC to visual stimuli.
Amplitudes of the associative responses to a 5 kHz pure tone, FM tone, harmonic tone, FM harmonic tone, and a “meow” sound (red columns). Columns with lines show means and SEMs. Concentric circles and stars were used as visual shape stimuli. Amplitudes of control responses with no pre-exposure are shown by a blue column.

