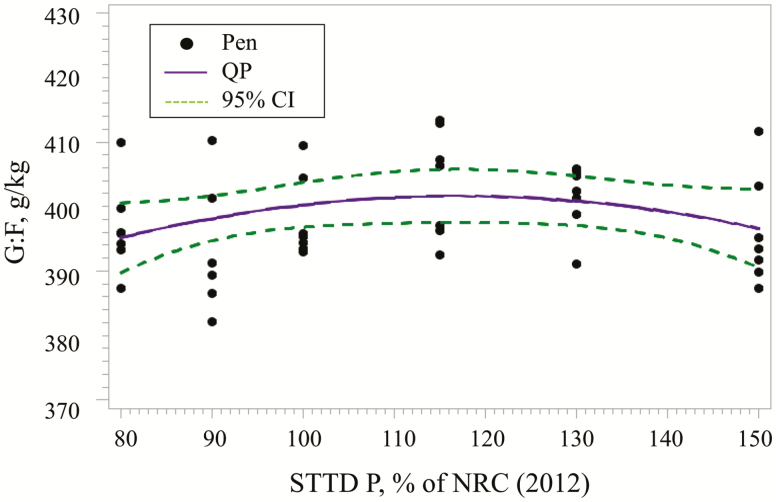
Figure 2.
Fitted QP regression model for G:F as a function of increasing STTD P in 24- to 130-kg pigs. The QP model estimated the maximum mean G:F at 116% (95% CI: [90, >150%]) of the NRC (2012) recommendations within phases. Based on the QP model, the estimated regression equation was G:F, g/kg = 338.34 + 108.98 × (STTD P) – 46.7864 × (STTD P)2.

