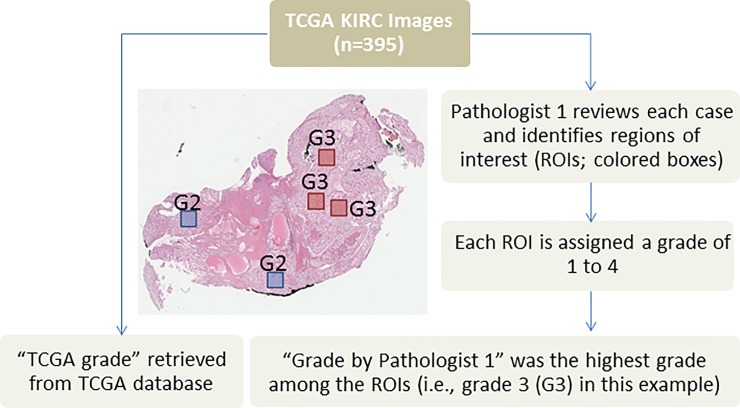
Fig 1. Schematic diagram showing how regions of interest (ROIs) were identified by Pathologist 1.
Pathologist 1 identified ROIs and assigned a Fuhrman grade for each ROI. The highest grade among all ROIs was the “Grade by Pathologist 1”. Each case also had a “TCGA grade” retrieved from the TCGA database.

