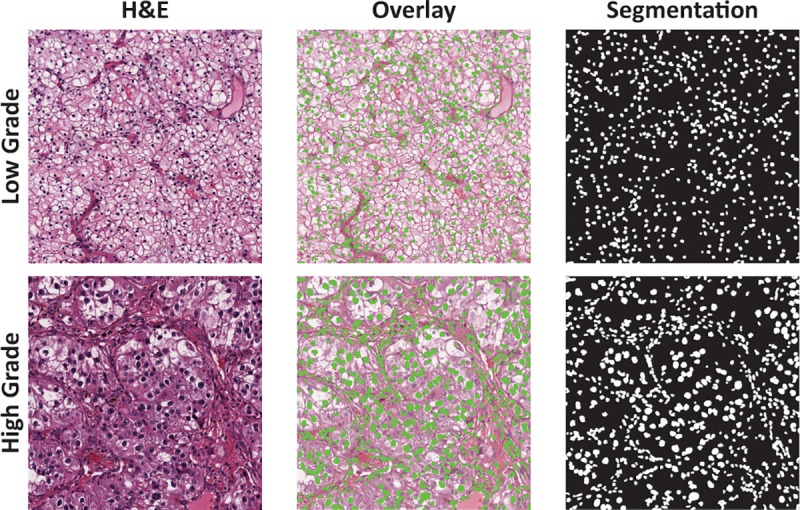
Fig 3. Examples of nuclei detection and segmentation in low and high grade clear cell renal cell carcinoma.

The rightmost column shows computer-generated segmentation mask where cell nuclei are labelled white against a black background. The middle column shows the overlay of segmented nuclei (green spots) over each hematoxylin and eosin (H&E) patch.
