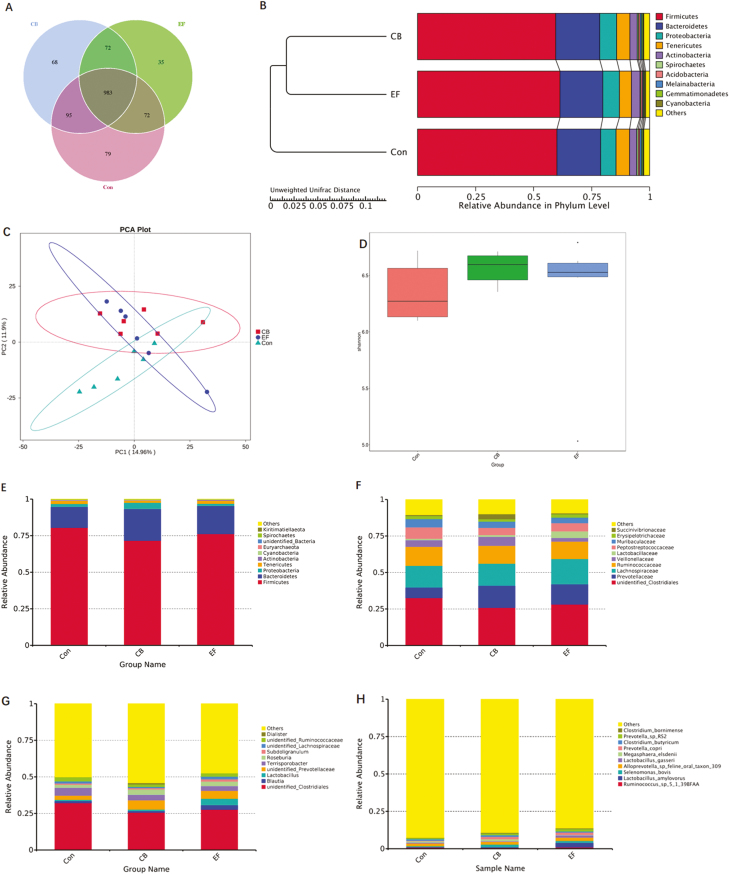
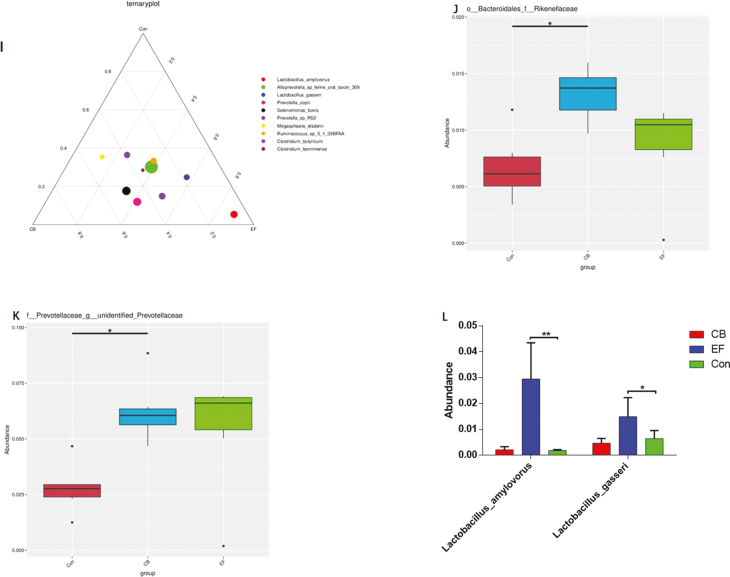
Figure 6.
Summary of microbial community in colon contents of weaned piglets. (A) The Venn diagram summarizing the numbers of common and unique OTUs in the microflora community in colonic contents of weaning piglets. (B) UPGMA Cluster Tree displaying the relative abundances of predominant bacteria at the species level in each group (unweighted UniFrac distance). (C) Principle component analysis plot about the colonic microflora. (D) Shannon index reflecting species diversity within and between groups. (E–H) The top 10 relative abundance of microflora community (level phylum, family, genus, species). (I) Differences of dominant species between groups (level species). (J–L) Species with significant differences between groups (level family, genus, species). Con represents the control piglets challenged with LPS; CB represents the piglets supplemented with the C. butyricum challenged with LPS; EF represents the piglets supplemented with E. faecalis challenged with LPS. OTU, operational taxonomic unit. Piglets were regarded as the experimental units, each treatment with n = 6. *Means different (P < 0.05), ** means significant difference (P < 0.01)


