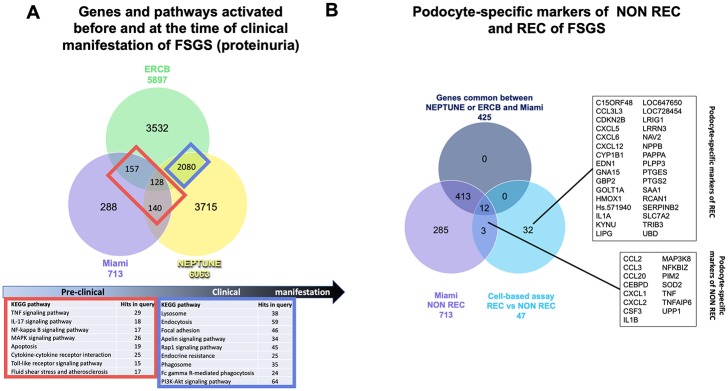
Fig 3. Identification of glomerular markers of primary FSGS and of podocyte-specific markers of non-recurrent and recurrent FSGS.
(A) Venn diagram analysis of the gene expression profiles obtained from glomerular biopsies of patients with FSGS from the NEPTUNE cohort and of the ERCB cohort demonstrating that 128 genes are commonly regulated in all three cohorts, while 157 genes are commonly regulated between the Miami and the ERCB and 140 genes between the Miami and the NEPTUNE cohort. 2080 genes are commonly regulated between the ERCB and NEPTUNE cohorts. KEGG pathway analysis indicates the activation of inflammatory pathways in early FSGS progression and of phagocytotic pathways in later progression. (B) Microarray analysis identifies podocyte-specific genes regulated in podocytes cultured in the presence of sera from healthy subjects and from patients with REC or NON REC FSGS. Validation of the cell-based assay was obtained through comparison to the gene expression profiles obtained by analysis of glomerular biopsies obtained from the Miami, NEPTUNE and ERCB cohorts. Microarray analysis identifies 15 podocyte specific genes of NON REC FSGS and 33 genes were specifically regulated in human podocytes contacted with the sera from patients with REC compared to NON REC. Abbreviations of gene symbols are listed in Table 3.

