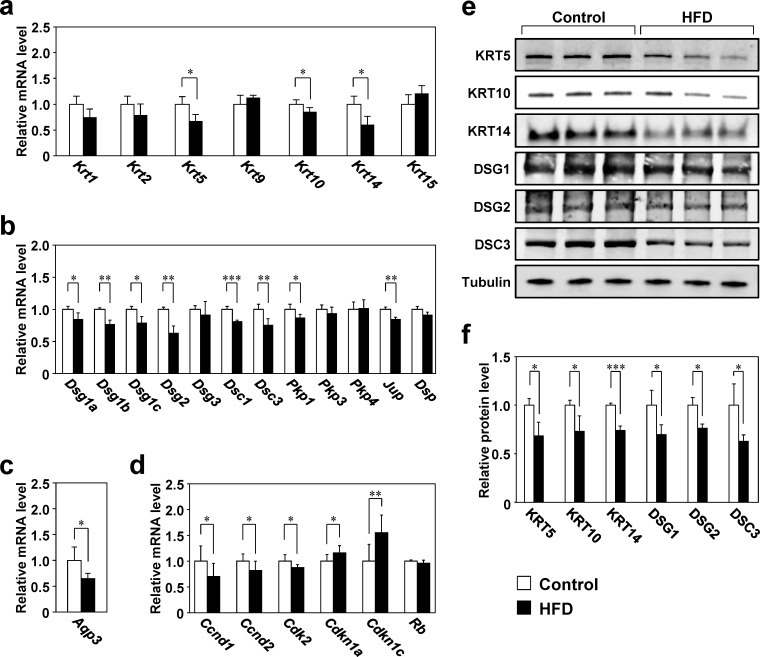
Fig 2. Gene and protein expression in the skin of mice fed the control diet or HFD.
a–d: RNA was isolated from the back skin of mice fed the control diet or HFD for 26 weeks, and gene expression was analyzed by RT-qPCR. The expression level of each target gene was normalized to that of 36B4 and is shown relative to that of the control group. Values are means ± SD (N = 8). *p < 0.05, **p < 0.01, and ***p < 0.001 vs. the control group (Student’s t-tests).e, f: Total proteins extracted from the dorsal skin were analyzed by western blotting and their levels were normalized to that of α-tubulin. Values are means ± SD (N = 3). *p < 0.05 and ***p < 0.001 vs. the control group (Student’s t-tests).

