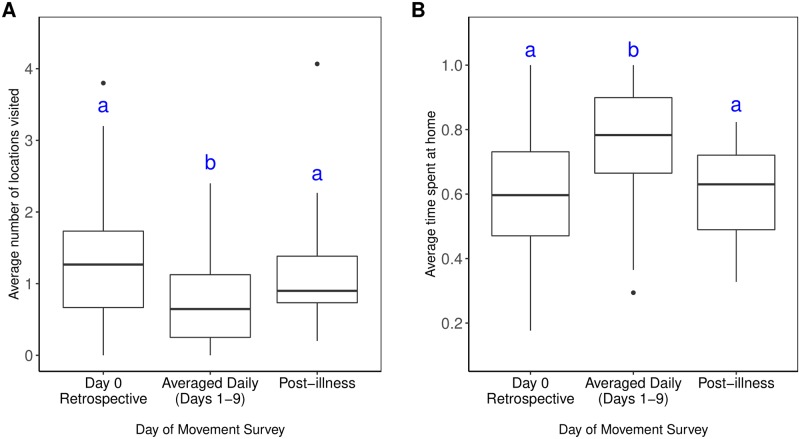
Fig 1. Mobility values throughout illness.
(A) Average number of locations visited during each time period (B) Average proportion of time spent at home during each time period. Significant differences, denoted by letters, were detected using pairwise paired Wilcoxon Sign Rank tests with Bonferroni’s correction to account for a family-wise error-rate of 0.05. All significant differences had p-values < 0.01.

