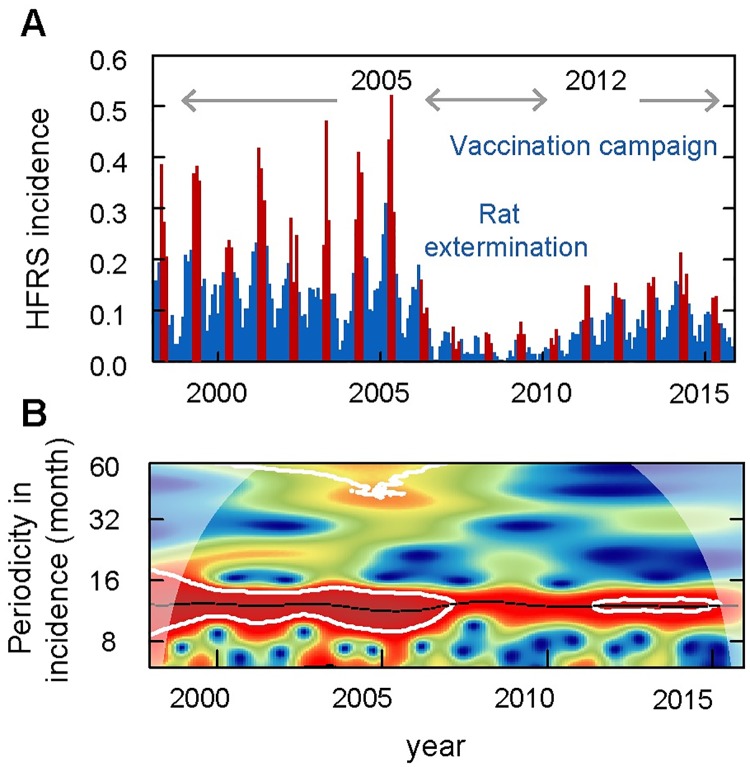
Fig 1. Seasonality and periodicity of hemorrhagic fever with renal syndrome (HFRS) incidence in Huludao City, 1998 to 2015.
(A) HFRS incidence per month. Red bars represent disease incidence in spring (March to May), while blue bars represent the other months. (B) Periodic variety of HFRS incidence. Colors indicate the power of the wavelet, where red to blue represent strong to weak power and the black line indicates the maximum power. The white line represents statistical significance (P < 0.05).

