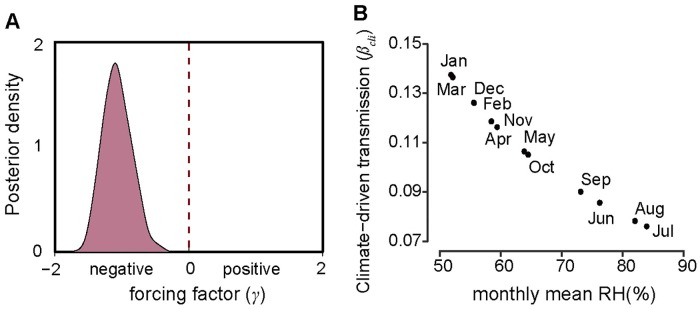
Fig 3. Force of infection and transmission rate of the seasonality of HFRS risk.
(A) Posterior distribution of climate-driven transmission potential (βcli), represented by forcing factor (γ). The power function with negative exponent (γ) means a negative relationship between transmission and relative humidity. (B) The effect of seasonal changes in relative humidity on climate-driven transmission potential estimated from Eq (4).

