
Figure 5f:
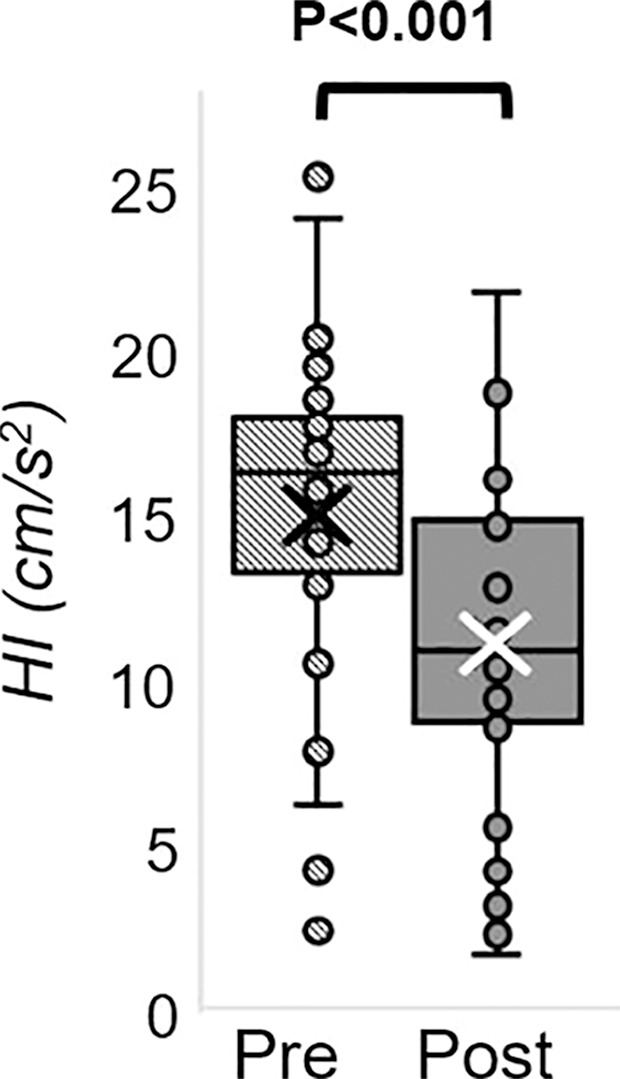
MRI-derived vascular parameters before and after e-cigarette vaping. Box-and-whisker plots for the strongest effects observed show (a) SvO2 during baseline (SvO2b), (b) SvO2 washout time (TW), (c) SvO2 overshoot, (d) luminal flow-mediated dilation (FMDL), (e) peak hyperemic blood flow velocity (VP), and (f) hyperemic index (HI). P values were derived on the basis of paired t tests. The boxes represent inner quartiles; horizontal lines within the box indicate the median and crosses (X) indicate the mean.