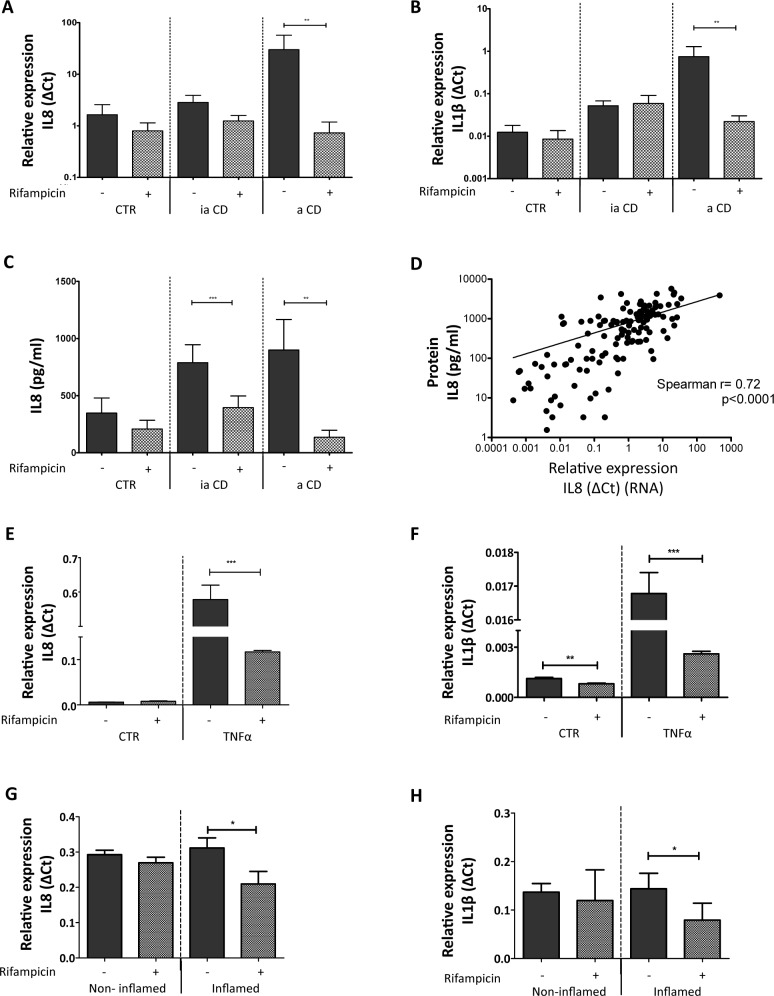
Fig 1. Effects of with rifampicin treatment on cytokine expression in human intestinal biopsies.
(A) IL-8 mRNA expression in human intestinal biopsies. The graph represents the mean IL-8 mRNA expression on a log scale, from biopsies stimulated with solvent only (0.1% (v/v) DMSO) or 100 μM Rifampicin for 18 h at 37 oC. CTR are the biopsies from control patients (n = 36), ia CD signifies biopsies from CD patients without active intestinal inflammation (n = 66), and a CD indicates biopsies from CD patients with active intestinal inflammation (n = 40). (B) IL-1βmRNA expression in human intestinal biopsies. For this graph the same labeling applies as in A. The error bar denotes SEM, ** p<0.01. (C) IL-8 protein expression in human intestinal biopsies. ELISA was used to measure the IL-8 protein concentration from biopsy homogenates. The same biopsies were used as for the mRNA expression analysis in A and B. The error bar is SEM, ** p<0.01, *** p<0.001. (D) Correlation between IL-8 mRNA levels and protein levels. The IL-8 mRNA expression (dCt = δCT) is plotted against the IL-8 protein (pg/mL) measured per biopsy. The Spearman correlation is depicted as well, r = 0.72, p<0.0001. (E) & (F) IL-8 mRNA levels and IL-1β levels, respectively, as measured in human intestinal organoids. The graph represents the mean IL-8 mRNA expression stimulated with solvent only (0.1%(v/v) DMSO) or 100 μM Rifampicin for 18 h at 37 oC. The TNFα group was treated with 10 ng/ml TNFα for 24 h while the CTR group was stimulated with solvent only. (G) & (H) IL-8 and IL-1β expression in the intestinal organoid from the patient of inflammation bowel disease. The non-inflamed group represents the organoid derived from non-inflamed tissue and the inflamed group represents the organoid derived from inflamed tissue of the same patient.

