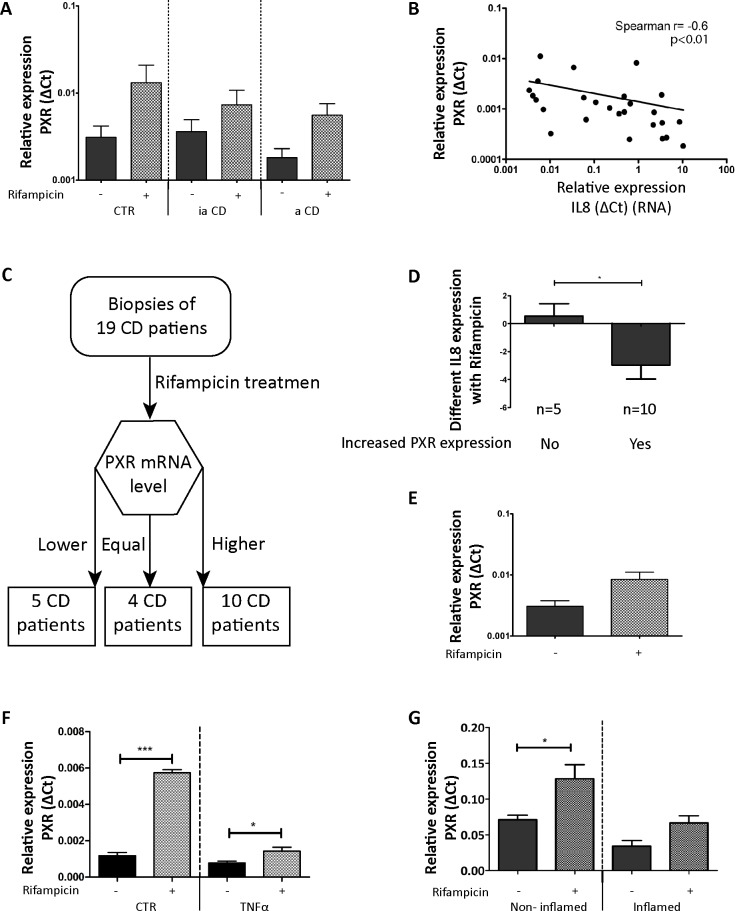
Fig 2. PXR expression levels and relation to NF-κB activity.
(A) PXR mRNA levels in human intestinal biopsies. CTR are the biopsies from control patients (n = 36), ia CD signifies biopsies from CD patients without active intestinal inflammation (n = 66), and a CD indicates biopsies from CD patients with active intestinal inflammation (n = 40). The error bar is SEM. (B) Correlation between IL-8 mRNA levels and PXR mRNA levels in non-rifampicin-challenged biopsies. (C) Flowchart used for dividing CD patients into groups based on induction of PXR expression by Rifampicin treatment. The CD patients were divided into three groups: Group 1 (5 CD patients) show lower PXR expression after the Rifampicin treatment; Group 2 (4 CD patients) have equal expression of PXR before and after Rifampicin treatment; Group 3 (10 CD patients) have increased PXR expression after the Rifampicin treatment. (D) Effects of rifampicin on IL-8 expression as stratified by the effects of Rifampicin on PXR expression. The error bar is SEM, *p<0.05. (E) PXR expression in all biopsies with or without Rifampicin stimulation. The error bar is SEM, p = 0.056. (F) PXR mRNA expression in human intestinal organoids. The graph represents the mean PXR mRNA expression measure when stimulated with solvent only (0.1%(v/v) DMSO) or 100 μM Rifampicin for 18 h at 37 oC. The TNFα group was treated with 10 ng/ml TNFα for 24 h while the CTR group was stimulated with solvent only. The error bar is SEM.*p<0.05. ***p<0.001. (G) PXR mRNA expression in non-inflamed and inflamed intestinal organoids from IBD patient. The same methodology as in Fig 1G was used. The error bar is SEM. *p<0.05.

