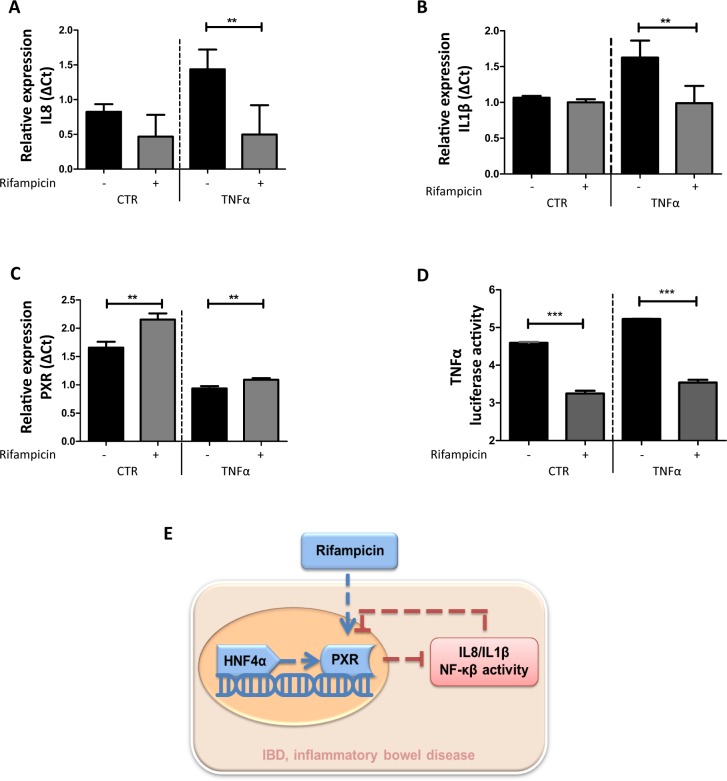
Fig 4. PXR and NF-κB axis activity in CACO2 cells.
(A) &(B) IL-8 and IL-1β mRNA expression in CACO2 cells, respectively. CACO2 cells were stimulated with solvent only (0.1% (v/v) DMSO) or 100 μM Rifampicin for 16 h at 37 oC. The TNFα group was treated with 10ng/ml TNFα for 24 h while the CTR group was stimulated with solvent only. The error bar is SEM, and **p<0.01. (C) PXR expression in CACO2 cells. (D) TNFα luciferase activity in CACO2 cells. The same stimulation methods were used as in A. (E) Schematic diagram illustrating the mutual repression of PXR and NF-κB.

