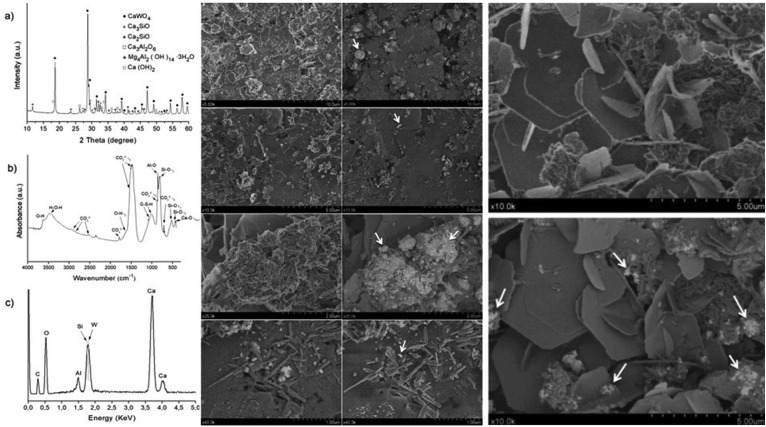
Figure 5.
LEFT. Characterization of hydrated MTA HP Repair material: a) XRD pattern; (b) FT-IR and, (c) EDX analysis. CENTRE. Secondary (left column) and back-scatter (right column) FEG-SEM images of hydrated MTA HP Repair material surface at four different magnifications. Scale bars: 10 μm; 5 μm; 2 μm and 1μm. White arrows drawn indicate CaWO4 component distribution. RIGHT. Comparison of FEG-SEM second (top) and back-scatter (down) images of the hydrated MTA Repaid HP material surface. White arrows drawn indicate CaWO4 phase distribution.

