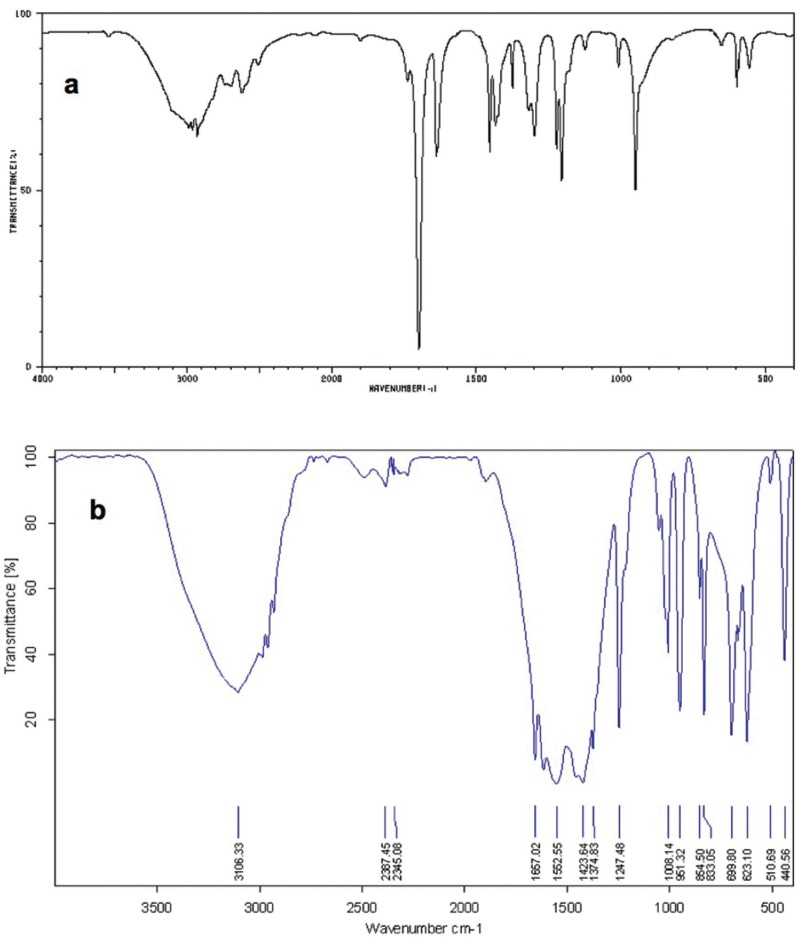
Figure 4.
The IR diagram of the methacrylic acid (a) demonstrate the strong 1738 cm-1 band which is related to C=O resonance and the 1110 cm-1 area that is related to C-O bonds. However, after reaction (b), the C=O is shifted to 1667 cm-1 while the Zn-O absorbance band is visible around the 440 cm-1 confirming the ZDMA formation.

