. 2019 Sep 3;8:e48847. doi: 10.7554/eLife.48847

Figure 1. RAS-induced H/ACA snoRNAs are required for oncogene-induced senescence in vivo.

(A) Volcano plot displays Log2 fold change in H/ACA snoRNA levels 5 days following HRASG12V expression in primary human skin fibroblasts measured by snoRNA qPCR array from three independent experiments. SnoRNAs in red exhibit statistically significant fold change in expression in HRASG12V expressing cells compared to controls (p<0.05, unpaired Student’s t-test or FDR < 0.1). SnoRNAs highlighted with labels were independently validated as shown in Figure 1—figure supplement 1B. (B) Graph illustrates mean ± SD mean fluorescent intensity (MFI) of the amount of de novo protein synthesis in primary human fibroblasts 5 days following expression of HRASG12V compared to control treated cells by measuring OPP incorporation into newly synthesized protein from three independent experiments. Statistical analysis was performed using an unpaired Student’s t-test, p=0.0001. (C) Analysis of SNORA24 levels in HCC specimens compared to adjacent non-tumor tissue of 91 HCC patients (GSE25097) (paired Student’s t-test, p<1.35×10⁻⁹) (left panel) and Kaplan-Meier curve showing overall survival of HCC patients with high or low SNORA24 levels (mean ± 1 SD of SNORA24 levels) (right panel). Statistical significance was calculated using the log-rank test, with p=0.03. (D) Representative image for NRAS, p21, and SA-β-Gal staining in liver sections or resected liver lobes (SA-β-gal wholemount staining) 6 days following delivery of NRASG12V and treated with control LNA (LNA-ctrl) or LNA targeting Snora24 (LNA-24). Graph shows mean ± SD mean intensity of SA-β-gal staining in liver from mice treated with LNA-ctrl (n = 3 mice) or LNA-24 (n = 3 mice) 6 days following NRASG12V expression. Statistical analysis was performed using an unpaired Student’s t-test, p=0.005.

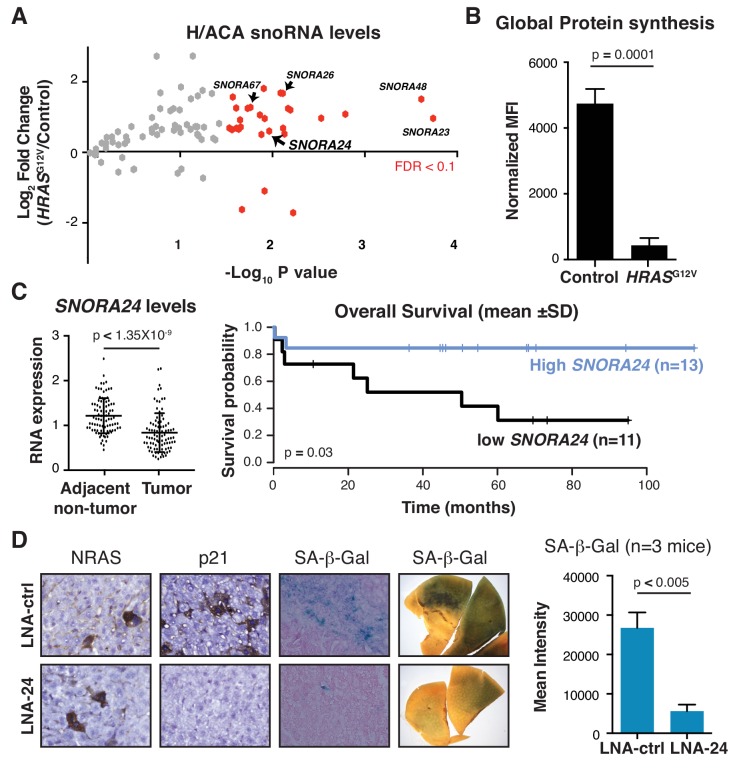
Figure 1—source data 1. H/ACA snoRNA levels upon oncogenic HRAS expression.
DOI: 10.7554/eLife.48847.010

Figure 1.

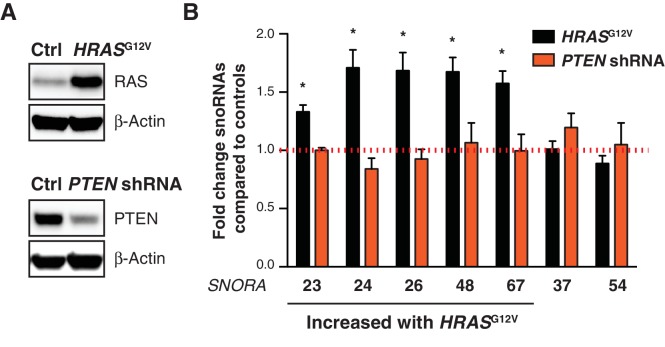
Figure 1—figure supplement 1. Select RAS-induced snoRNAs are not altered upon PTEN reduction.

Figure 1—figure supplement 1.

(A) Analysis of RAS protein 5 days following HRASG12V or empty vector expression in primary human skin fibroblasts by western blot. β-Actin was used as a loading control (top panel). Analysis of PTEN protein 5 days following shRNA targeting PTEN or control non-targeting shRNA in primary human skin fibroblasts by western blot. β-Actin was used as a loading control (bottom panel). (B) qPCR analysis of the indicated snoRNAs 5 days following HRASG12V expression (black bars) or PTEN reduction (PTEN shRNA, orange bars) in primary human skin fibroblasts measured by qPCR. Graph shows mean fold change expression ± SD relative to control cells and normalized to the levels of RN7SK from three independent experiments. Statistical analysis was performed using an unpaired Student’s t-test, *p < 0.05.
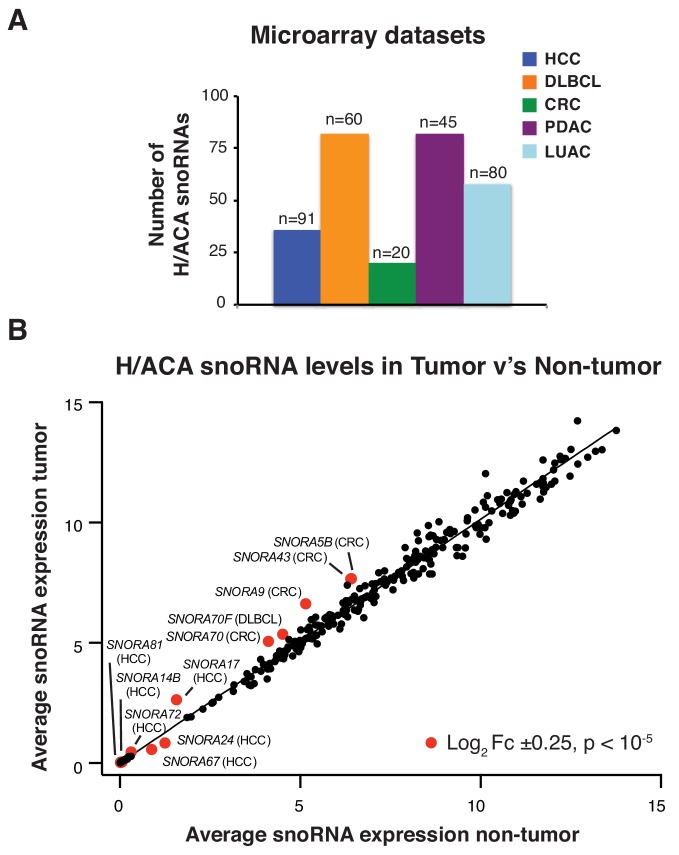
Figure 1—figure supplement 2. Altered expression of distinct H/ACA snoRNAs in human cancers.

Figure 1—figure supplement 2.

(A) Graph shows the number of distinct H/ACA snoRNAs analyzed in the indicated microarray gene expression datasets; HCC GSE25097, Diffuse large B-cell lymphoma (DLBCL) GSE22898, Colorectal cancer (CRC) GSE20916, Pancreatic ductal adenocarcinoma (PDAC) GSE28735, and Lung adenocarcinoma (LUAC) GSE43458. The number of patient samples analyzed in each dataset is indicated over the corresponding column. (B) Graph shows average H/ACA snoRNA expression in all tumor samples compared to controls from each microarray gene expression dataset indicated in A. Red dots highlight H/ACA snoRNAs that exhibit changes in expression between tumor and controls of greater than Log2 fold change ± 0.25 and p<0.00005.
Figure 1—figure supplement 2—source data 1. H/ACA snoRNA levels in human cancer.
DOI: 10.7554/eLife.48847.006
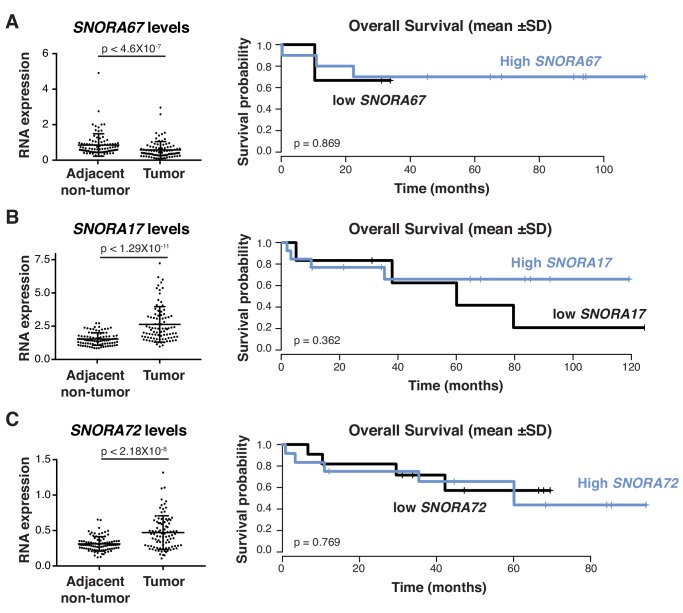
Figure 1—figure supplement 3. Association between H/ACA snoRNA levels and patient survival in HCC.

Figure 1—figure supplement 3.

(A) Analysis of SNORA67 levels in HCC specimens compared to adjacent non-tumor tissue of 91 HCC patients (GSE25097) (paired Student’s t-test, p<4.6×10⁻⁷) (left panel) and Kaplan-Meier curve showing overall survival of HCC patients with high or low SNORA67 levels (mean ± 1 SD of SNORA67 levels) (right panel). (B) Analysis of SNORA17 levels in HCC specimens compared to adjacent non-tumor tissue of 91 HCC patients (GSE25097) (paired Student’s t-test, p<1.29×10⁻¹¹) (left panel) and Kaplan-Meier curve showing overall survival of HCC patients with high or low SNORA17 levels (mean ± 1 SD of SNORA17 levels) (right panel). (C) Analysis of SNORA72 levels in HCC specimens compared to adjacent non-tumor tissue of 91 HCC patients (GSE25097) (paired Student’s t-test, p<2.18×10⁻⁸) (left panel) and Kaplan-Meier curve showing overall survival of HCC patients with high or low SNORA72 levels (mean ± 1 SD of SNORA72 levels) (right panel).
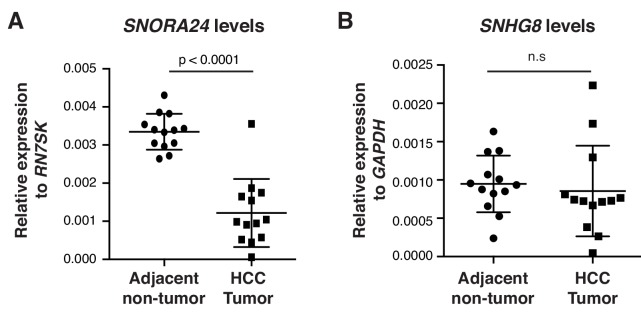
Figure 1—figure supplement 4. SNORA24 is reduced in primary human HCC specimens.

Figure 1—figure supplement 4.

(A) qPCR analysis of SNORA24 in HCC tissue and matched adjacent non-tumor tissue. Graph shows mean ± SD SNORA24 levels normalized to the expression of RN7SK. Statistical analysis was performed using a paired Student’s t-test, p<0.0001. (B) qPCR analysis of SNHG8 in HCC tissue and matched adjacent non-tumor tissue. Graph shows mean ± SD SNHG8 levels normalized to the expression of GAPDH. Statistical analysis was performed using a paired Student’s t-test, n.s = non significant.
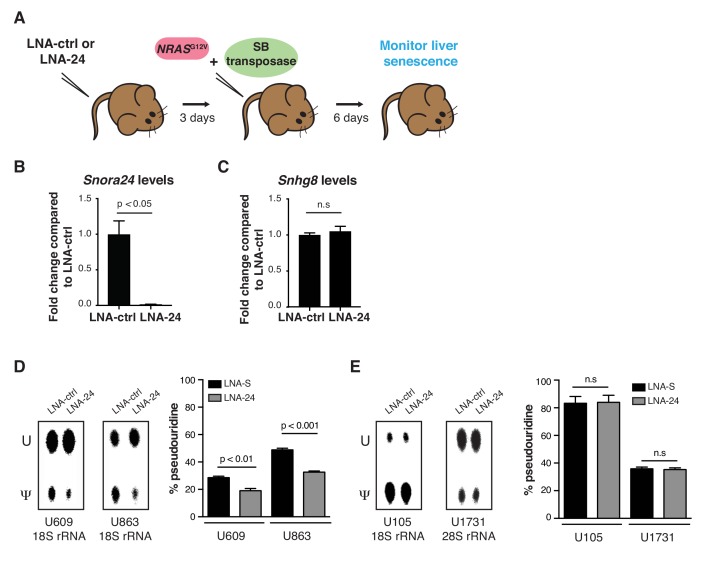
Figure 1—figure supplement 5. Loss of Snora24 cooperates with RAS to promote the development of HCC resembling human SH-HCC.

Figure 1—figure supplement 5.

(A) Cartoon outlines the experimental approach to target Snora24 in vivo and test the requirement of Snora24 in RASG12V-induced senescence in the mouse liver using a previously established system (SB(+)NRASG12V). (B) qPCR analysis of Snora24 in liver from LNA-ctrl and LNA-24 treated mice. Graph shows mean fold change expression ± SD relative to LNA-ctrl treated mice and normalized to the levels of Rn7sk from n = 4 mice. Statistical analysis was performed using an unpaired Student’s t-test, p<0.05.(C) qPCR analysis of Snhg8 in liver from LNA-ctrl and LNA-24 treated mice. Graph shows mean fold change expression ± SD relative to LNA-ctrl treated mice and normalized to the levels of Gapdh from n = 4 mice. Statistical analysis was performed using an unpaired Student’s t-test, n.s = non significant. (D) Representative thin layer chromatography (TLC) of site-specific amounts of pseudouridine (Ψ) or uridine (U) present at position U609 and U863 on 18S rRNA in primary fibroblasts transfected with LNA-S or LNA-24 for 48 hours (hrs) (left panel). Quantification of TLC showing the percentage pseudouridine at position U609 (left) and U863 (right) on 18S rRNA. Graph shows mean ± SD percentage pseudouridine for the indicated residue from three independent experiments. Statistical analysis was performed using an unpaired Student’s t-test, p<0.01 and p<0.001 (right panel). (E) Representative TLC of site-specific amounts of pseudouridine (Ψ) or uridine (U) present at position U105 on 18S rRNA and U1731 on 28S rRNA in primary fibroblasts transfected with LNA-S or LNA-24 for 48 hrs (left panel). Quantification of TLC showing the percentage pseudouridine at position U105 (left) and U1731 (right) on 18S rRNA and 28S rRNA, respectively. Graph shows mean ± SD percentage pseudouridine for the indicated residue from three independent experiments. Statistical analysis was performed using an unpaired Student’s t-test, n.s = non significant (right panel).