. 2019 Sep 3;8:e48847. doi: 10.7554/eLife.48847

Figure 2. Snora24 plays a role in the initiation and maintenance of RAS-driven hepatocellular carcinoma.

(A) Representative images of explanted livers from control (SB(-)NRASG12V) or SB(+)NRASG12V mice treated with either LNA-ctrl or LNA-24. (B) H and E staining of a liver section from SB(+)NRASG12V mouse treated with LNA-24. Black arrows highlight the presence of fat droplets. (C) Graph shows mean ± SD percentage Oil Red O (ORO) positive area in liver tumor nodules and adjacent non-tumor tissue from n = 3 SB(+)NRASG12V mice treated with LNA-24. For each mouse liver section, the amount of ORO positive stain per total area from at least four distinct tumor and non-tumor regions (as determined by H and E staining) was measured (see Materials and methods and Figure 2—figure supplement 1). Statistical analysis was performed using a paired Student’s t-test, p=0.0107). (D) Quantitative PCR (qPCR) analysis of Snora24 levels in wild-type liver or age- and sex-matched liver tumors from Alb-cre;KrasG12D mice. Graph shows mean ± SD Snora24 expression normalized to the levels of Rn7sk from n = 3 mice per condition. Statistical analysis was performed using an unpaired Student’s t-test, p<0.02. (E) Kaplan-Meier curves showing survival in male C57BL/6 wild-type mice following intrahepatic orthotopic injection of Ctrl KrasG12D HCC cells (black line, n = 4 mice) and sgRNA-24 KrasG12D HCC cells (gray dashed line, n = 4 mice), p=0.017, log-rank test (left panel). qPCR analysis of Snora24 in Ctrl KrasG12D and sgRNA-24 KrasG12D HCC cells (right panel). Graph shows mean relative expression ± SD normalized to the levels of Rn7sk from three independent experiments. Statistical analysis was performed using an unpaired Student’s t-test, *p < 0.05. (F) Representative image of ORO staining in HCC from a patient with high SNORA24 (bottom) or low SNORA24 (top) expression. Quantification of ORO stain in tissue sections from HCC patients dichotomized into high or low by identifying samples with SNORA24 expression greater than ±one SD from the mean (n = 17 HCC specimens). Graph shows mean ± SD percentage Oil Red O (ORO) positive area present in HCC tissue specimens from patients with high or low SNORA24 expression and statistical analysis was performed using an unpaired Student’s t-test, p=0.0453.

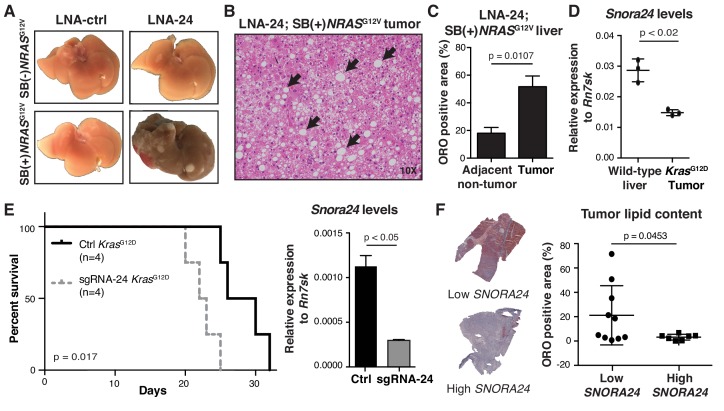
Figure 2.

Figure 2—figure supplement 1. Increased lipid content in tumor regions of LNA-24; SB(+)NRASG12V mice.

Figure 2—figure supplement 1.

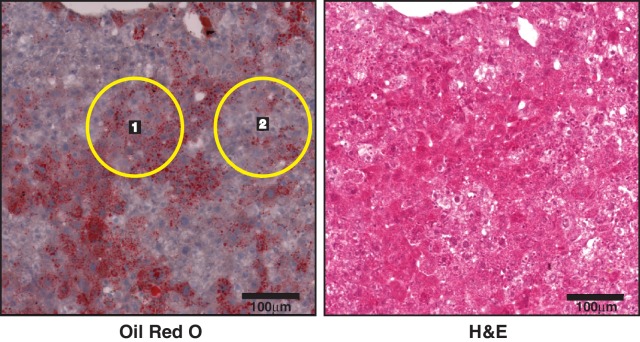
Representative image of ORO stain (left) and H and E (right) from liver of a SB(+)NRASG12V mouse treated with LNA-24. Lipid content (ORO stain) in tumor (yellow circle numbered 1) or adjacent non-tumor liver tissue (yellow circle numbered 2), as indicated by H and E staining, was quantified from at least four distinct tumor and non-tumor regions per mouse liver section (from n = 3 mice) and presented in Figure 2C.
Figure 2—figure supplement 2. Reduction of Snora24-guided modifications in mouse KrasG12D liver cancer cells using CRISPR-Cas9 gene editing.

Figure 2—figure supplement 2.

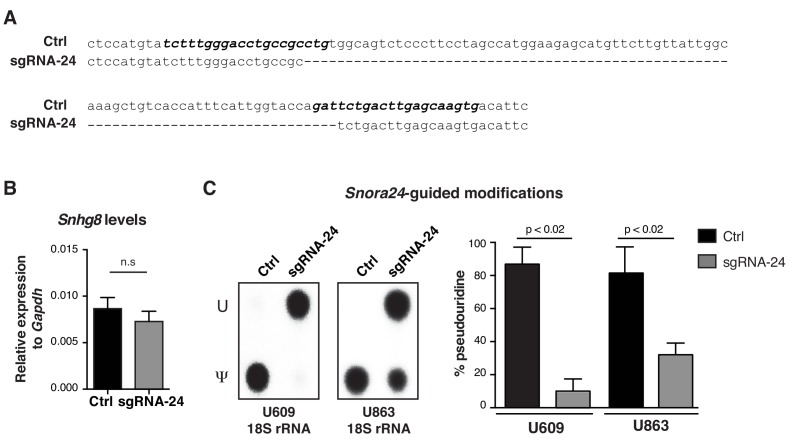
(A) The mouse Snora24 gene sequence is shown (Ctrl) aligned to the sequence of the Snora24 gene upon generating an 81 nucleotide deletion following CRISPR-Cas9 gene editing in KrasG12D HCC cells (sgRNA-24). The binding sites of the sgRNAs used to target mouse Snora24 are highlighted in bold and italics. (B) qPCR analysis of Snhg8 in Ctrl KrasG12D and sgRNA-24 KrasG12D HCC cells. Graph shows mean relative expression ± SD normalized to the levels of Gapdh from three independent experiments. Statistical analysis was performed using an unpaired Student’s t test, n.s = non significant. (C) Representative TLC of site-specific amounts of pseudouridine (Ψ) or uridine (U) present at position U609 and U863 on 18S rRNA using SCARLET in Ctrl KrasG12D and sgRNA-24 KrasG12D HCC cells (left panel). Quantification of TLC showing the percentage pseudouridine at position U609 (left) and U863 (right) on 18S rRNA using SCARLET in Ctrl KrasG12D and sgRNA-24 KrasG12D HCC cells. Graph shows mean ± SD percentage pseudouridine for the indicated residue from three independent experiments. Statistical analysis was performed using an unpaired Student’s t-test, p<0.02 (right panel).
Figure 2—figure supplement 3. Reduction of SNORA24 in HuH-7 cells using CRISPR-Cas9 gene editing.

Figure 2—figure supplement 3.

(A) qPCR analysis of SNORA24 in HuH-7 sgRNA-24 cells compared to HuH-7 sgRNA-ctrl cells. Graph shows mean SNORA24 expression ± SD normalized to the levels of RN7SK from three independent experiments. Statistical analysis was performed using an unpaired Student’s t-test, p<0.001. (B) Representative image of LipidTOX (neutral lipid stain) and DAPI (nuclei) stain in HuH-7 sgRNA-24 (right image) compared to sgRNA-ctrl (left image) cells 6 hrs following Oleic Acid (OA) addition to the media. Graph shows mean ± SD fold change MFI LipidTOX stain from n = 3 independent experiments. Statistical analysis was performed using an unpaired Student’s t-test, p<0.02.