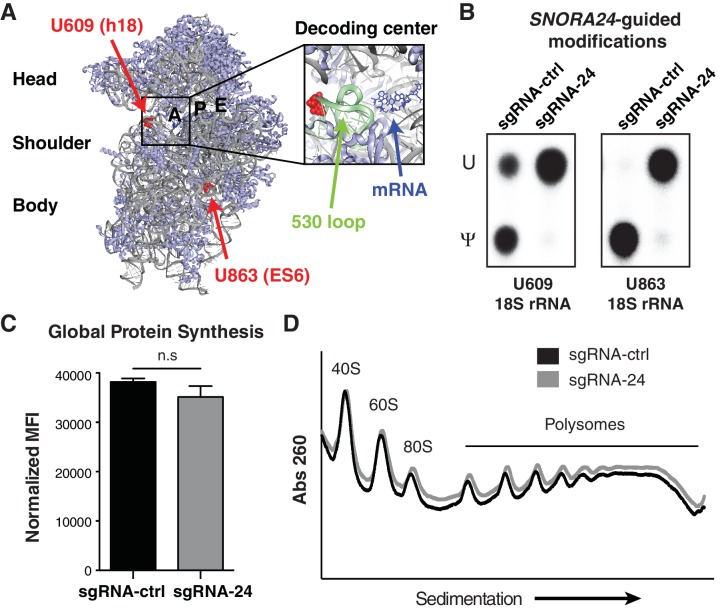
Figure 3. Loss of SNORA24-guided pseudouridine modifications does not impact global protein production in HCC cells.
(A) SNORA24 target residues U609 and U863 are highlighted (in red) on the structure of the mammalian 40S ribosomal subunit (Protein Data Bank (PDB) ID: 5LZS [Shao et al., 2016] and visualized with PyMOL). 18S rRNA is in gray, the mRNA in the decoding center is highlighted in blue, and the ‘530 loop’ is highlighted in pale green. (B) Representative thin layer chromatography (TLC) of site-specific amounts of pseudouridine (Ψ) or uridine (U) present at position U609 and U863 on 18S rRNA using SCARLET in HuH-7 sgRNA-ctrl or sgRNA-24 cells. (C) Graph illustrates mean ± SD mean fluorescent intensity (MFI) of the amount of de novo protein synthesis in HuH-7 sgRNA-24 cells compared to HuH-7 sgRNA-ctrl cells by measuring OPP incorporation into newly synthesized protein from three independent experiments. Statistical analysis was performed using an unpaired Student’s t-test, n.s = non significant. (D) Representative polysome profiles of HuH-7 sgRNA-ctrl (black line) and sgRNA-24 (gray line) cells. Lower molecular weight (MW) complexes (40S and 60S) are on the left side of the x axis and higher MW complexes (polysomes) are on the right side.
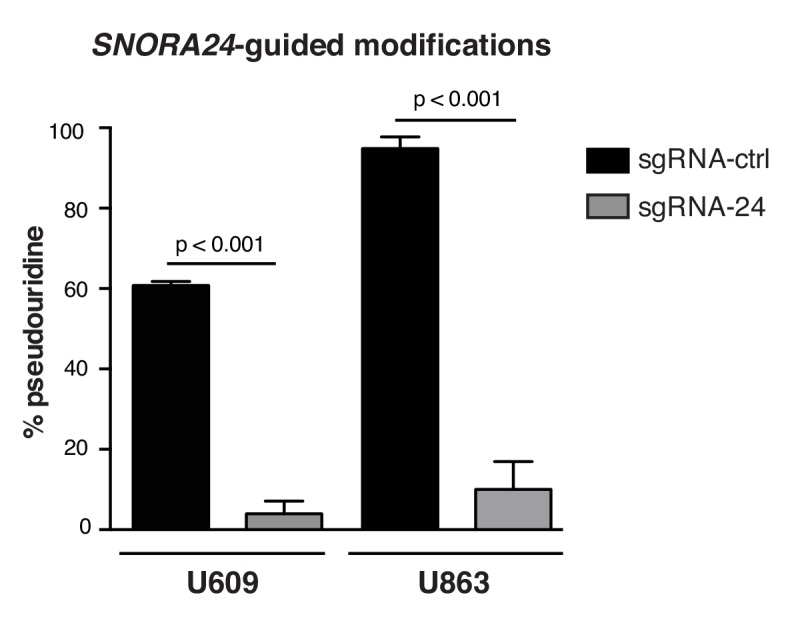
Figure 3—figure supplement 1. Loss of SNORA24-guided modifications in HuH-7 cells with reduced SNORA24.


