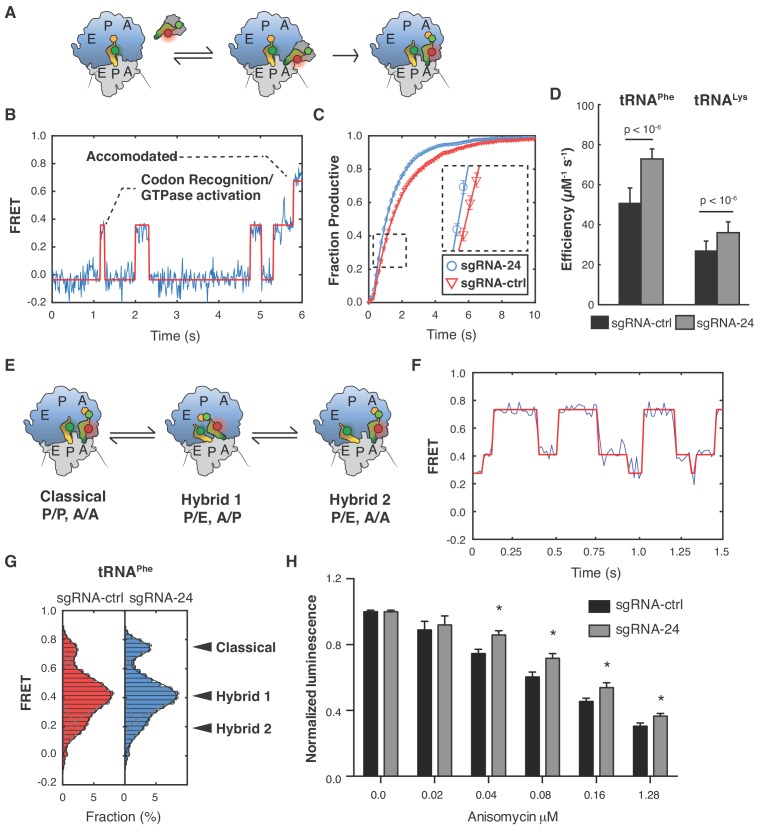
Figure 4. Ribosomes lacking SNORA24-guided modifications display alterations in aa-tRNA selection and pre-translocation complex dynamics.
(A) Schematic representation of the reaction assayed in the smFRET experiments. Ternary complex consisting of eEF1A, GTP, and fluorescently labeled aa-tRNA (either LD655-tRNAPhe or LD650-tRNALys) binds to ribosomes, carrying Cy3 labeled Met-tRNAfMet in the P site and displaying a cognate codon (UUC or AAA) in the A site, bringing the two dyes close enough for FRET. After binding, the ternary complex either dissociates or codon recognition, GTP hydrolysis, and subsequent dissociation of eEF1A takes place followed by accommodation of the CCA end of the tRNA into the peptidyl transferase center and subsequent peptide bond formation. These conformational changes within the decoding ribosome complex lead to a stepwise increase in FRET until stable accommodation of the tRNA occurs. (B) Representative smFRET trace of ribosome purified from HuH-7 sgRNA-ctrl cells displaying a UUC codon reacting with LD655-tRNAPhe containing ternary complex. Non-productive events are characterized by rapid fluctuations in FRET values between 0.2 ± 0.075 and 0.46 ± 0.075, followed by dissociation of the ternary complex and loss of FRET. Productive events are characterized by a stepwise progression from 0.2 ± 0.075, through several intermediate FRET values to a final FRET of 0.72 ± 0.075. The red line represents a hidden Markov-model idealization of the smFRET trace. (C) Cumulative distributions for ribosomes purified from HuH-7 sgRNA-ctrl (red line) and sgRNA-24 (blue line) cells displaying a UUC codon reacting with LD655-tRNAPhe containing ternary complex. Distributions were constructed from all recorded individual smFRET traces by estimating the number of productive events that occurred at each movie frame. The solid lines represent exponential functions fitted to the data. The error bars represent SEM for each data point. For simplicity, data from every tenth movie frame is shown. (D) Graph shows catalytic efficiency (kcat/KM) for LD655-tRNAPhe or LD650-tRNALys containing ternary complexes reacting on ribosomes purified from either HuH-7 sgRNA-ctrl or sgRNA-24 cells and displaying the respective cognate codons, UUC or AAA, in the A site. The error bars represent SEM for the estimated kcat/KM values. Statistical analysis was performed using Welch’s t-test, p<10−6. (E) Schematic representation of the dynamics of ribosome pre-translocation complexes. Each ribosome can occupy three distinct conformational states, the classical state; with both tRNAs in classical binding conformations with their anticodon stems and CCA ends occupying corresponding binding sites on the small and large ribosomal subunits. The first hybrid state; with both tRNAs in hybrid binding conformations with their anticodon stems and CCA ends occupying different binding sites on the small and large subunits, and the second hybrid state where the A-site tRNA is in a classical binding conformation while the P-site tRNA is in a hybrid binding conformation. (F) Representative smFRET trace of a pre-translocation complex containing P-site bound tRNAfMet and A-site bound Met-Phe-tRNAPhe. The highest FRET state corresponds to the classical state, the middle FRET state corresponds to the first hybrid state, and the lowest FRET state corresponds to the second hybrid state. The solid red line represents a hidden Markov-model idealization of the smFRET trace. (G) Histograms of FRET values attained by pre-translocation complexes from HuH-7 sgRNA-ctrl (red bars) and sgRNA-24 (blue bars) cells containing P-site bound tRNAfMet and A-site bound Met-Phe-tRNAPhe. The solid lines represent fits of three gaussian functions (gray lines) to the data and their sum (black line). The error bars represent SEM for the mean count in each histogram bin. Statistical analysis was performed using Welch’s t-test, p<10−6. (H) Graph shows mean ± SD normalized luminescence from CellTiter-Glo Luminescent Cell Viability Assay 48 hrs post-treatment of HuH-7 sgRNA-ctrl (black bars) or sgRNA-24 (gray bars) cells with increasing concentrations of Anisomycin from three independent experiments. Statistical analysis was performed using an unpaired Student’s t-test, *p<0.05.
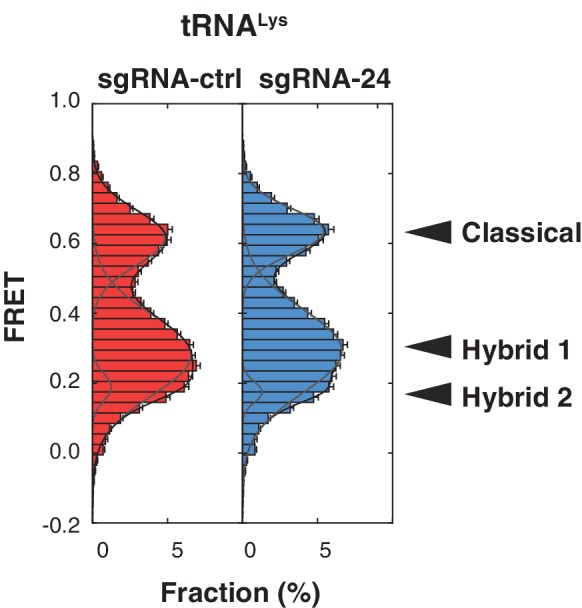
Figure 4—figure supplement 1. Loss of SNORA24-guided modifications does not impact the dynamics of pre-translocation complexes containing A-site bound Met-Lys-tRNALys.


