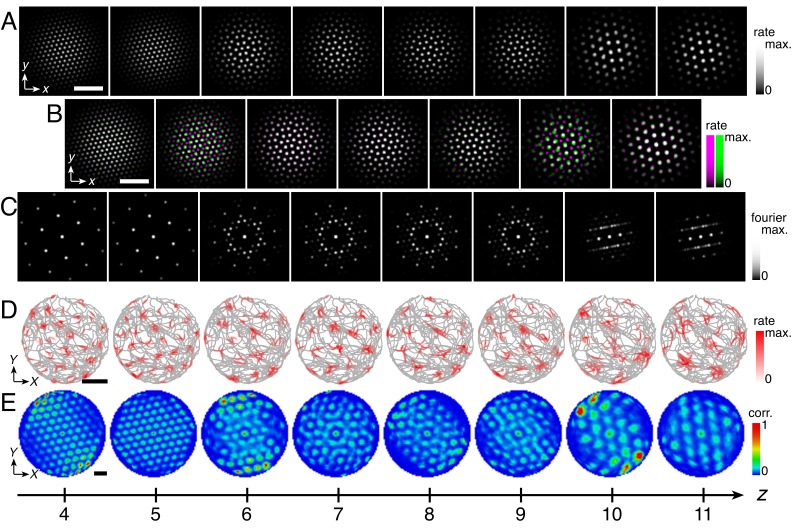
Appendix 3—figure 1. Quasicrystal approximant grids in a simulation with dorsal-to-ventral coupling.
Networks z = 4 to 11 shown out of 12 total. (A) Network activities at the end of the simulation. (B) Activity overlays between adjacent networks depicted in the top row. In each panel, the network at smaller (larger) z is depicted in magenta (green), so white indicates regions of activity in both networks. (C) Fourier power spectra for network activities with the origin at the center of each image and the edges cropped. (D) Spatial rate map of a single neuron for each z superimposed on the animal’s trajectory. (E) Spatial autocorrelations of the rate maps depicted in D. Network size n × n = 230 × 230, coupling spread d = 2, coupling strength umag = 0.6, maximum inhibition distance αexp = 0, and velocity gain α = 0.12 s/m. Other parameter values are in Table 1. White scale bars, 50 neurons. Black scale bars, 50 cm.

