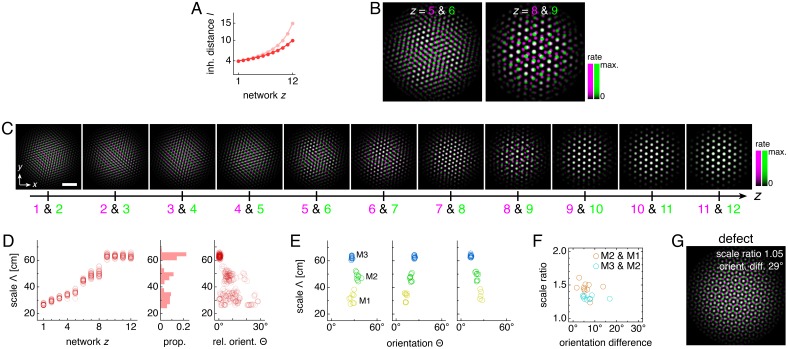
Figure 6. Discommensurate lattice relationships can produce realistic modules.
(A) We use a shallower inhibition distance profile l(z) (dark) compared to Figure 1C (light). (B) Large activity overlays from a representative simulation that emphasize discommensurate lattice relationships. (C) All activity overlays from the representative simulation in B between adjacent networks z in magenta and green, so white indicates activity in both networks. Scale bar, 50 neurons. (D–F) Data from 10 replicate simulations. (D) Left: spatial grid scales Λ(z). For each network, there are up to 30 red circles corresponding to three neurons recorded during each simulation. Middle: histogram for Λ collected across all networks. Right: spatial orientations Θ relative to the grid cell in the same simulation with largest scale. (E) Clustering of spatial scales and orientations for three representative simulations. Due to sixfold lattice symmetry, orientation is a periodic variable modulo 60°. Different colors indicate separate modules. (F) Spatial scale ratios and orientation differences between adjacent modules. (G) Representative activity overlay demonstrating defect with low activity overlap. Maximum inhibition distance lmax = 10, coupling spread d = 12. We use larger network size n × n = 230 × 230 to allow for discommensurate relationships whose periodicities span longer distances on the neural sheets. Other parameter values are in Table 1.


