. 2019 Aug 2;8:e46687. doi: 10.7554/eLife.46687

Figure 8. Lesioning a network changes grid scales and orientations of more dorsal networks.

(A) Lesion protocol. The lesion inactivates network z = 7. (B) A representative simulation before the lesion. Top row: network activities at the end of the pre-lesion simulation. Second row: activity overlays between adjacent networks depicted in the top row. In each panel, the network with smaller (larger) z is depicted in magenta (green), so white indicates activity in both networks. Third row: spatial rate map of a single neuron for each z superimposed on the animal’s trajectory. White scale bars, 50 neurons. Black scale bars, 50 cm. (C) Same as B but after the lesion. Spatial rate maps are recorded from the same neurons as in B. (D, E) Data from 10 replicate simulations. (D) Left: spatial grid scales Λ(z) before and after the lesion. Middle: histogram for Λ collected across all networks. Right: spatial orientations Θ relative to the grid cell in the same simulation with largest scale. (E) Spatial scale ratios and orientation differences between adjacent modules. Standard parameter values provided in Table 1.

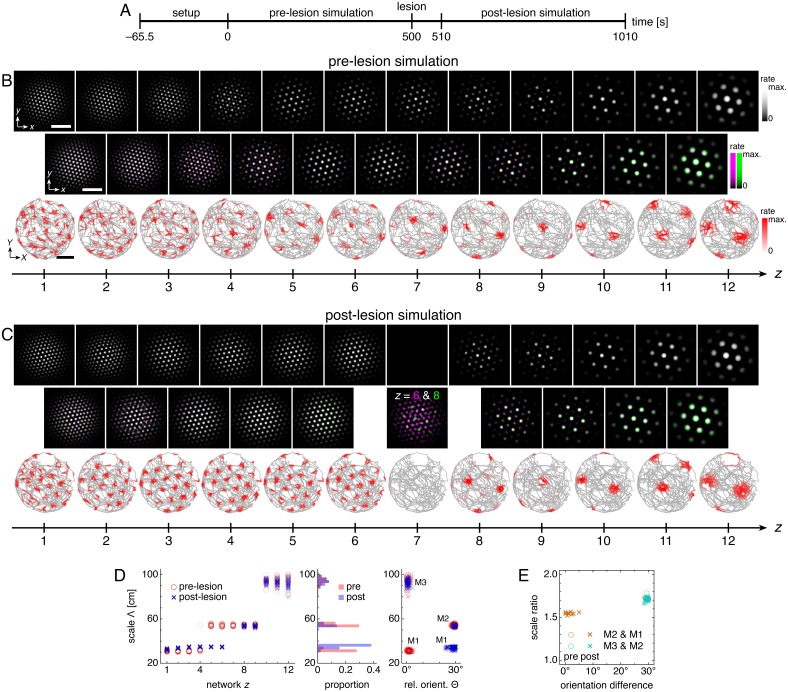
Figure 8.

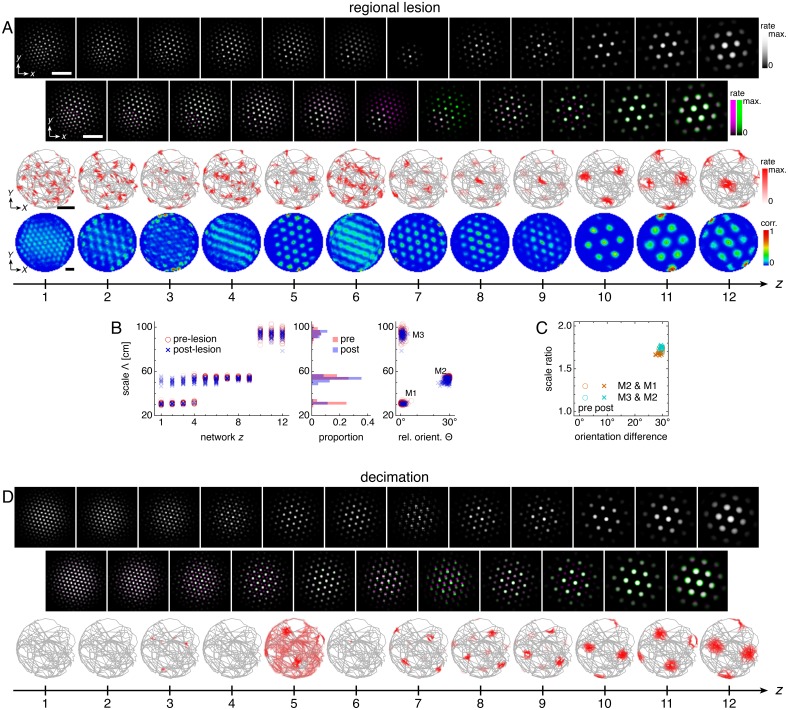
Figure 8—figure supplement 1. The effects of incomplete lesions on grid cells in more dorsal networks.

Figure 8—figure supplement 1.

(A–C) A regional lesion of network z = 7 that spares the lower left quadrant. (A) A representative post-lesion simulation. Top row: network activities at the end of the post-lesion simulation. Second row: activity overlays between adjacent networks depicted in the top row. In each panel, the network with smaller (larger) z is depicted in magenta (green), so white indicates activity in both networks. Third row: spatial rate map of a single neuron for each z superimposed on the animal’s trajectory. Bottom row: spatial autocorrelations of the rate maps depicted in the third row. White scale bars, 50 neurons. Black scale bars, 50 cm. (B) Left: spatial grid scales Λ(z) before and after the lesion. Middle: histogram for Λ collected across all networks. Right: spatial orientations Θ relative to the grid cell in the same simulation with largest scale. For each z, two neurons are selected from the lower left quadrant and two neurons are selected from elsewhere. (C) Spatial scale ratios and orientation differences between adjacent modules. (D) A representative post-lesion simulation of a decimation of network n = 7 that spares the top left neuron in every 3 × 3 block. Rows same as the top three rows of A.
Figure 8—video 1. Last 100 s of the simulation displayed in Figure 8—figure supplement 1A.
Download video file (1.6MB, mp4)
DOI: 10.7554/eLife.46687.023
Top left: accumulated rat trajectory (gray curve) with current rat position (blue dot). Top right, bottom left, and bottom right: activity overlays between adjacent networks with the network at smaller (larger) z depicted in magenta (green), so white indicates regions of activity in both networks. White scale bar, 50 neurons. Black scale bar, 50 cm.
Figure 8—video 2. Last 100 s of the simulation displayed in Figure 8—figure supplement 1D.
Download video file (1.5MB, mp4)
DOI: 10.7554/eLife.46687.024
Panels same as in Figure 8—video 1.