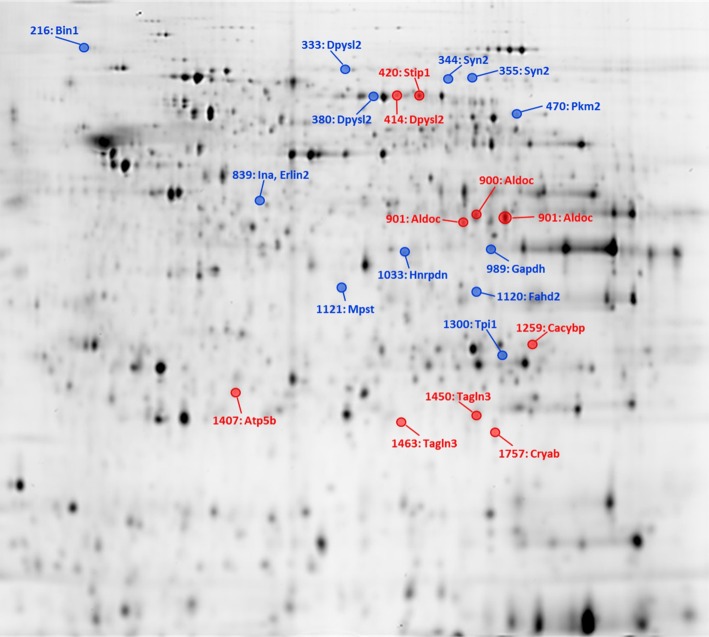
Fig. 1.
Representative 2-D DIGE gel with labeled locations of significantly altered hypothalamic preoptic area protein spots. The spot number and the major identified genes in the particular spot are shown. Red and blue circles indicate significantly increased and decreased protein spot changes of dams, respectively. (Color figure online)

