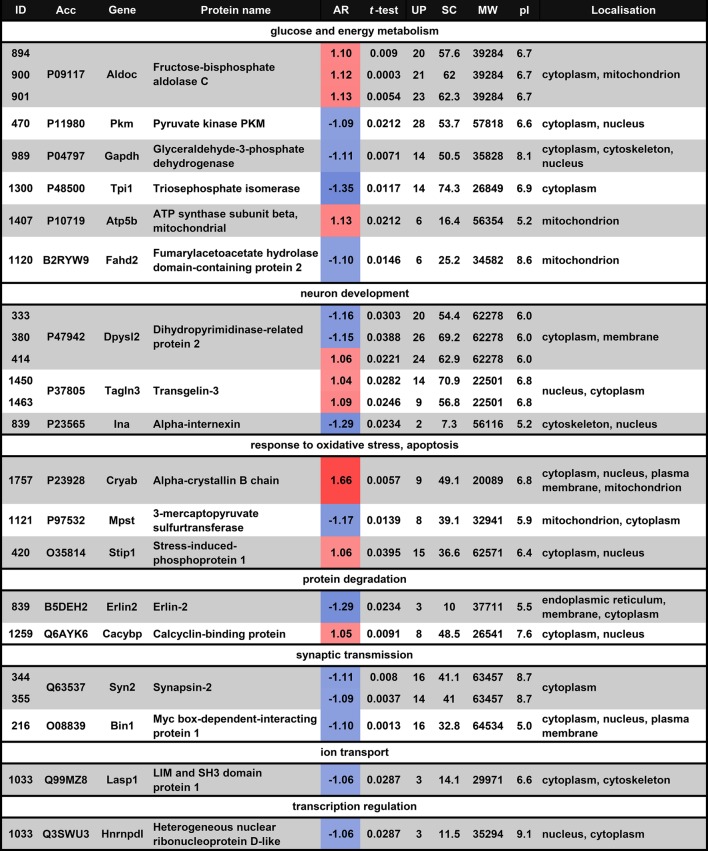
Fig. 6.
Significantly altered proteins in the hypothalamic preoptic area of mother rats assigned to functional clusters. The color gradient from red (elevated protein level) to blue (reduced protein level) is used to show the level of differential abundances of maternal proteins (the numbers represent the average ratio values). Acc accession number, AR average ratio, UP unique peptides number, SC% sequence coverage percentage, MW molecular weight, pI isoelectric point. (Color figure online)

