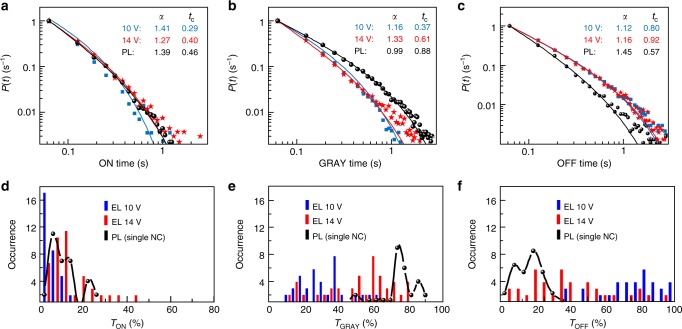
Fig. 3.
Blinking analysis of NC aggregates in EL and single NCs in PL. Probability density distributions (a–c) and distribution of fractional times (d–f) for ON (a, d), GRAY (b, e), and OFF states (c, f) for aggregates of CsPbBr3 NCs in EL (blue—10 V bias, red—14 V bias) and for PL of single CsPbBr3 NCs in PVK (black). All the probability density curves are fitted with a truncated power law equation () and the fitting coefficient values are shown in the individual plots. A fractional time of a state reflects a percentage of the whole measurement interval over which the NC was in such state

