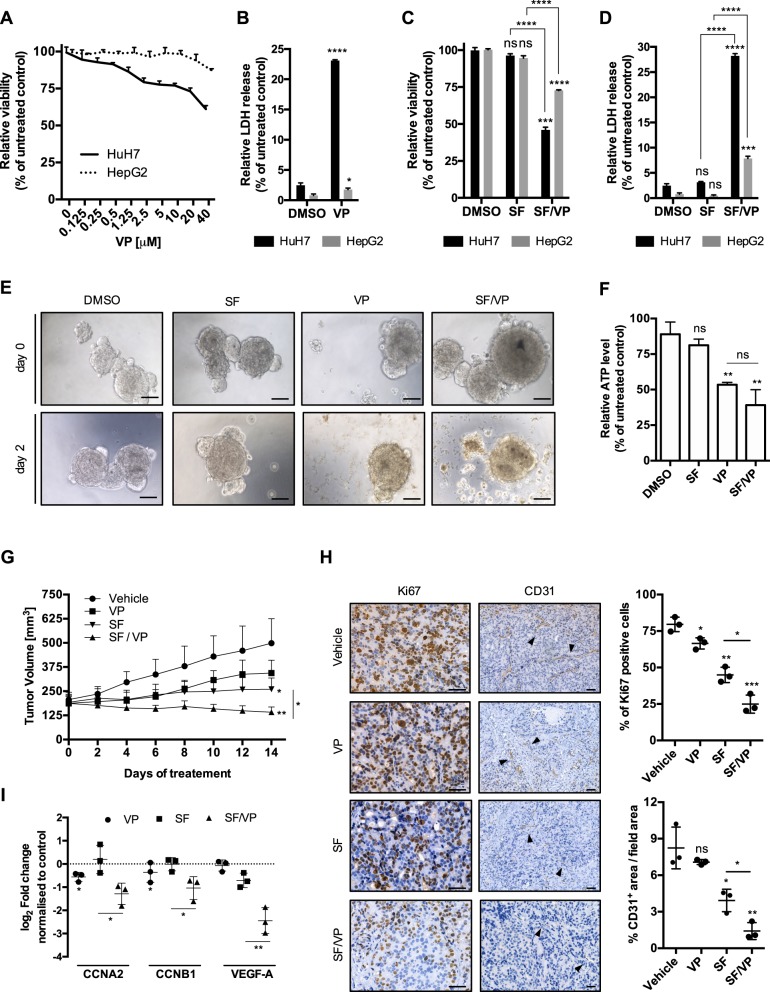
Fig. 1. VP potentiates the anti-tumor effect of SF in vitro and in vivo.
a Mean ± SD of HuH7 and HepG2 relative viability was analyzed after 24 h of VP treatment at different concentrations. Values were normalized to untreated cells, n = 3. b Mean ± SD relative of HuH7 and HepG2 LDH release after 24 h treatment with verteporfin (VP – 20 μM). Values were normalized to untreated cells. n = 3. c Mean ± SD of HuH7 and HepG2 relative viability was analyzed after 24 h treatment with sorafenib (SF – 5 μM) or in combination with verteporfin (SF – 5 μM/VP - 20 μM). Values were normalized to untreated cells. n = 3. d Mean ± SD relative of HuH7 and HepG2 LDH release after 24 h treatment with sorafenib (SF - 5 μM) or in combination with verteporfin (SF – 5 μM/VP – 20 μM). Values were normalized to untreated cells. n = 3. e Representative bright-field images of HCC patient–derived tumoroids treated with SF (5 μM), VP (20 μM), both drugs combined together (SF/VP) and vehicle-treated for 2 days. Scale bar 50 μm. f Mean ± SD of ATP level detected by CellTiter-Glo® 3D Cell Viability Assay (Promega) of HCC patient-derived tumoroids (PDT) after SF (5 μM), VP (20 μM) and both drugs combined together (SF/VP) treatment for 2 days. Values were normalized to vehicle-treated PDT after 2 days, n = 3. g Tumor volume of HCC patient-derived xenografts mice (n = 3/group) treated with vehicle, verteporfin (VP – 100 g/kg – i.p. every second day), sorafenib (SF – 60 g/kg – daily oral gavage) and VP/SF combination for 14 days. h HCC PDX immunohistochemistry for Ki67 and CD31 (black arrows) in vehicle, VP, SF and VP/SF treated animals after 14 days. Counterstain: hematoxylin. Scale bar 200 μm. The graphs show the mean percentage ± SD of Ki67 positive cells and CD31 positive areas per tumor/mouse (three random fields were used for the analysis per tumor/mouse). i HCC PDX real-time qPCR data of cell-cycle progression (CCNA2 and CCNB1) and vascular endothelial growth factor A (VEGF-A) genes after VP, SF and VP/SF treated animals after 14 days. Values were normalized to the vehicle-treated mice. P values < 0.05 were considered statistically significant and are indicated as follows: *P < 0.05; **P < 0.01; ***P < 0.001; ****P < 0.0001; ns, not significant

