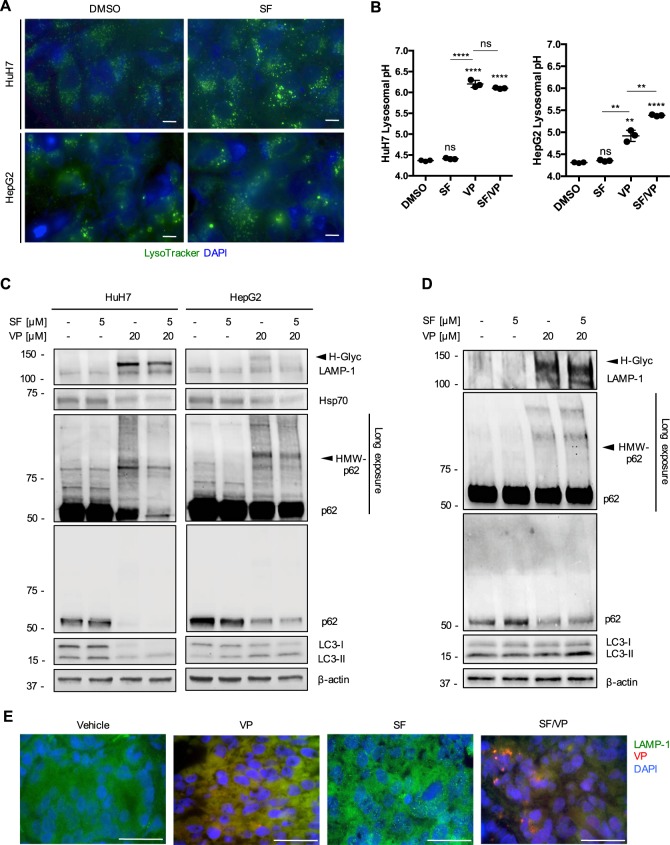
Fig. 6. SF induces an accumulation of lysosomes in vitro and in vivo.
a Representative HCC cell-images live-stained with Lysotracker (1 h, 100 nM) in the Cy3 channel, treated with sorafenib (SF, 5 μM) for 24 h. Nuclei were stained with DAPI. Scale bar 25 μm. b Mean ± SD of lysosomal pH values measured by flow cytometry in HuH7 and HepG2 pre-incubated in culture medium supplemented with FITC-dextran (0.1 mg/mL, 72 h) after treatment with SF (5 μM), VP (20 μM) and both drugs combined together (VP/SF) for 24 h. n = 3. c Representative immunoblots for LAMP-1, Hsp70, p62, LC3B, and β-actin in HuH7 and HepG2 cells after VP (20 μM, 24 h), SF (5 μM, 24 h) treatment and both compounds combined together. d Representative immunoblots for LAMP-1, p62, LC3, and β-actin in HCC patient-derived tumoroids (PDT) after VP (20 μM, 24 h), SF (5 μM, 24 h) treatment and both compounds combined together, n ≥ 3. e Illustrative immunofluorescence images on cryosections of LAMP-1 and VP autofluorescence (Cy5 channel) from HCC patient-derived xenografts after 14 days of treatment with vehicle, VP, SF and SF/VP. Nuclei were stained with DAPI. Scale bar 50 μm. P values < 0.05 were considered statistically significant and are indicated as follows: *P < 0.05; **P < 0.01; ***P < 0.001; ****P < 0.0001; ns, not significant

