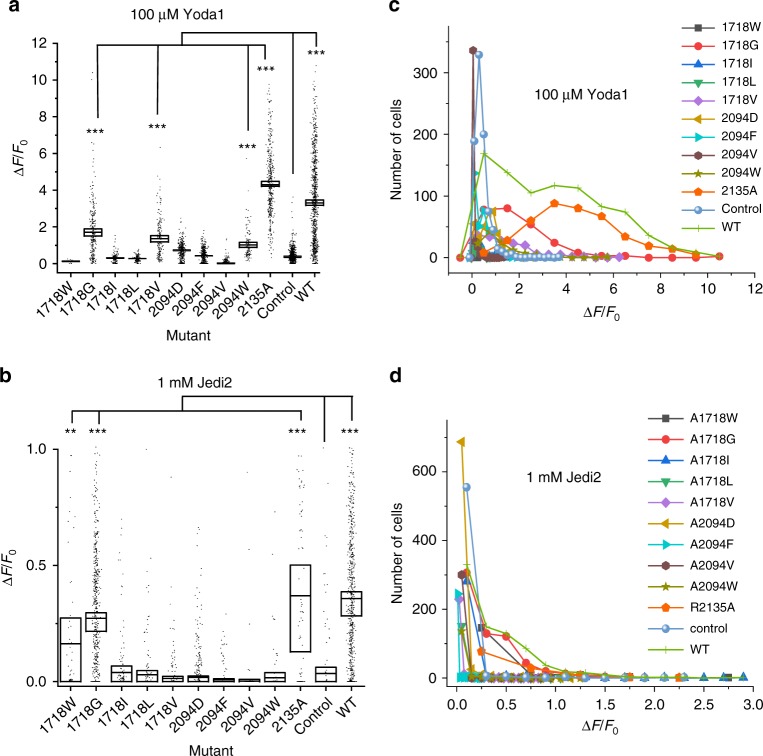
Fig. 4.
Coupling between chemical activation pathways in Piezo1. ΔPZ1 cells were co-transfected with GC6 and one of the indicated A1718 and A2094 mutant construct or with GC6 only (control). The relative amplitude of calcium signals (ΔF/F0) obtained by application of 100 µM Yoda1 (a) or 1 mM Jedi2 (b) is shown as a dotted box plot. For statistical analysis, cells from at least three independent experiments were pooled and considered as independent points (n values between 12 and 877). The box upper and lower limits represent standard error of mean values (shown as horizontal inner lines). Source data are provided as a Source Data file. Comparison of the mean values between WT/mutants and control was done using two-tails t-tests. Asterisks indicate standard p-value range. *, 0.01 < p < 0.05; **, 0.00 1 < p < 0.01; ***, p < 0.001 and n.s. (non-significant): p > 0.05. Statistical results are only shown for mutants exhibiting ΔF/F0 larger than control conditions. For clarity, the number of analyzed cells is from (a) and (b) are plotted as function of the range of ΔF/F0 values obtained with 100 µM Yoda1 (c) or 1 mM Jedi2 (d) for each tested mutant (gray rectangle: A1718W, red circles: A1718G, blue triangles: A1718I, green triangles: A1718L, purple diamonds: A1718V, gold triangles: A2094D, cyan triangles: A2094F, brown hexagons: A2094V, olive stars: A2094W, orange pentagons: R2135A, blue spheres: control and green crosses: WT)

