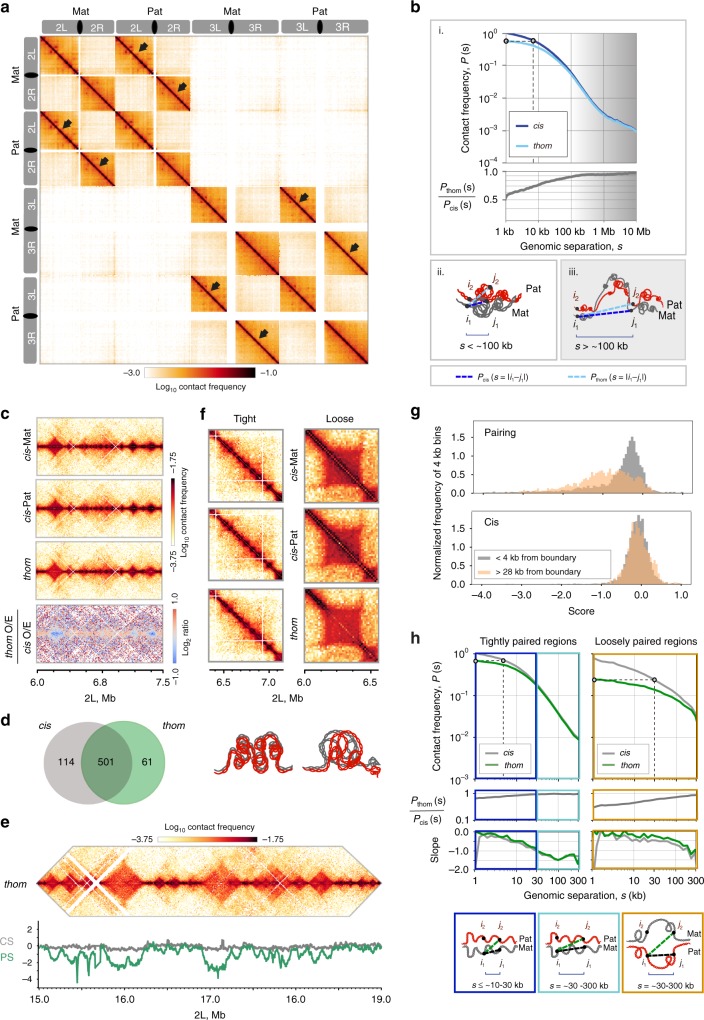
Fig. 2.
Homolog pairing is highly structured, encompassing tightly and loosely paired regions. a Contact map for the left (L) and right (R) arms of chromosomes 2 and 3. b, i. Top, cis and thom contact frequencies, P(s), plotted against genomic separation, s, normalized to cis frequency at s = 1 kb. Dotted line: thom contacts at s = 1 were as frequent as cis at s = 8 kb. Bottom, Pthom(s)/Pcis(s). Cis and thom contact frequencies differed noticeably at s < ~100 kb and were concordant at s > ~100 kb (shaded). b, ii–iii. Dashed lines, Pthom(s) as a function of s = |i1-j2| for loci i1 and j2 located on different homologs, compared to Pcis(s) for loci i1 and j1 separated by s = |i1-j1| on one homolog. Left, P(s) at s < ~100 kb. Right, P(s) at s > ~100 kb, shaded. c 1.5 Mb region on 2 L: Cis contact maps were concordant with each other and with the thom contact map. Bottom, thom/cis map showed concordance of thom with cis maps, apart from a depletion of contacts in some domains (blue). d Overlap of domain boundaries as defined by cis and thom contacts. e 4 Mb region of 2 L: Top, thom domains, and insulating boundaries. Bottom, pairing score (PS, green) and cis score (CS, gray). f Examples of tight and loose pairing with schematics of possible structures. g Distributions of PS and CS near (<4 kb, grey), or far from (>28 kb, orange) boundaries revealed higher pairing near boundaries. h Top, cis and thom contact frequencies, P(s), plotted against genomic separation, s, within tightly and loosely paired regions (normalized as in Fig. 2b). Middle, Pthom(s)/Pcis(s); bottom, slopes. Tightly paired regions showed two modes of decay, shallow (dark blue box) and steep (light blue box), while loosely paired regions showed one shallow mode (orange box). Dashed lines: thom contacts at s = 1 kb were as frequent as cis contacts at s = ~5 kb and ~30 kb in tightly and loosely paired region, respectively. Schematics illustrate differences in the organization of tightly and loosely paired regions

