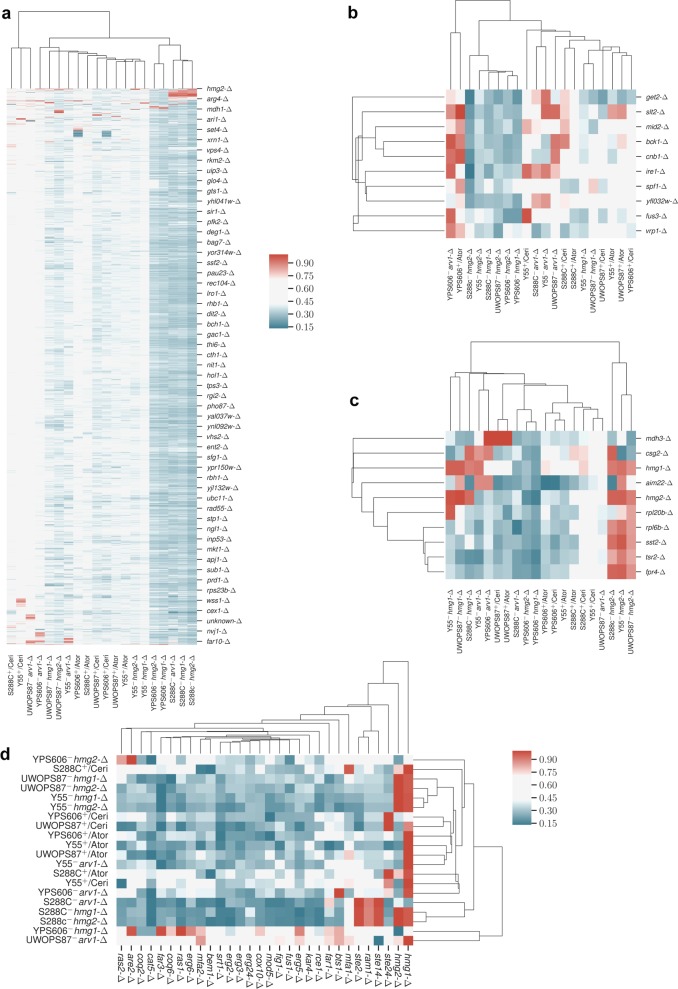
Fig. 3.
Hierarchical clustering of GINs represents overall genetic background variation throughout the genome and specifically the unfolded protein response and mevalonate pathway. a–d Hierarchical clustering of growth phenotypes showing a genome-wide deletion libraries, b IRE1 (the major mediator of UPR), c HMG1 and HMG2 (the targets of atorvastatin and cerivastatin), and d genes within and branching from the mevalonate pathway. One scale applies to a–c and the scale for d shown separately to the right of the cluster. All scales represent min–max normalised Z-scores

