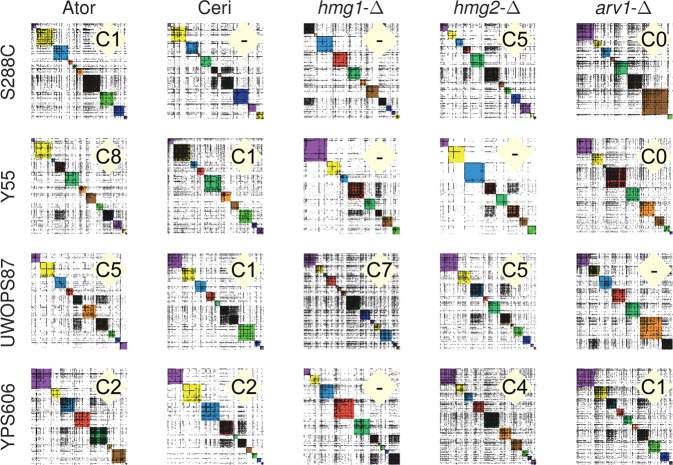
Fig. 4.
Community analysis reveals genetic background variation among GINs. Communities in each GIN were defined using community analysis described in the text. Communities shown in different colours (for visual distinction only) on the diagonal are numbered from zero at the top left where each GIN consists of between 7 and 14 communities (Supplementary Table S8). For example, the GIN in the first panel shows 10 communities. Community panels are labelled with community number (“C#”) denoting presence of the high ER/Golgi GO-term pattern described in the text

