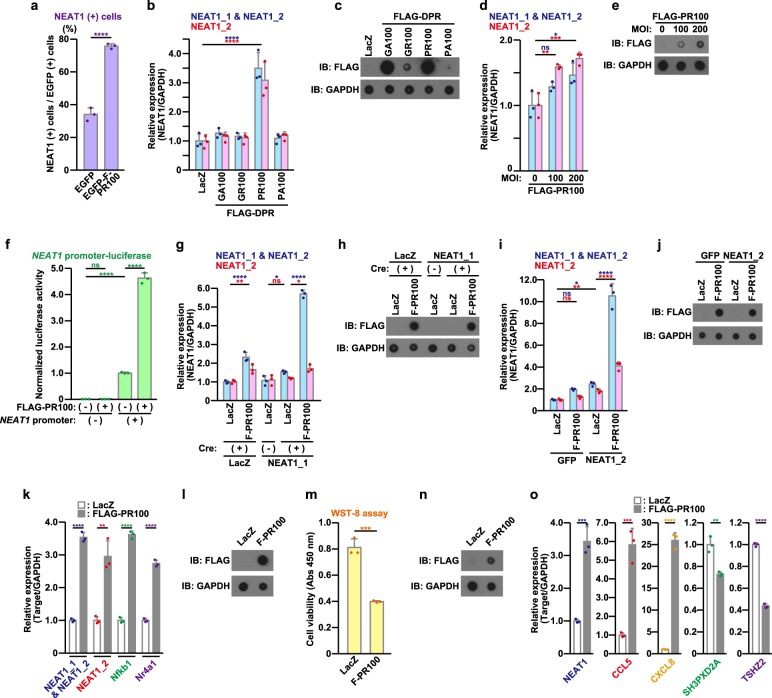
Fig. 2. Poly-PR induces nuclear paraspeckle assembly transcript 1 (NEAT1) expression.
a The number of EGFP- or EGFP-FLAG-PR100 (EGFP-F-PR100)-expressing paraspeckle-positive NSC34 cells in RNA FISH assay was counted (100 cells/count). The data are presented as means ± SD (N = 3). Statistical analysis was performed by the unpaired t-test. b, c NSC-34 cells were infected with indicated adenovirus vectors at a multiplicity of infection (MOI) of 800. At 48 h after the infection, the quantitative real-time PCR analysis of NEAT1 was performed (b). The cell lysates were subjected to dot blotting analysis using indicated antibodies (c). The data are presented as means ± SD (N = 3). Statistical analysis was performed by one-way analysis of variance (ANOVA) followed by the Dunnett’s multi comparisons test. d, e Primary cultured cerebral cortical neurons (PCNs) were infected with adenovirus encoding FLAG-PR100 at MOIs of 0–200. To keep the constant total MOIs of adenoviruses, appropriate MOIs of LacZ-encoding adenovirus were added for each infection. At 120 h after the infection, the quantitative real-time PCR analysis of NEAT1 was performed (d). The cell lysates were subjected to dot blotting analysis using indicated antibodies (e). The data are presented as means ± SD (N = 3). Statistical analysis was performed by one-way ANOVA followed by the Dunnett’s multi comparisons test. f NSC-34 cells were transfected with the NEAT1-promoter (+) or NEAT1-promoterless (−) luciferase vector together with the pEF1-Myc/His-vec (−) or the pEF1-FLAG-PR100 (+). At 48 h after the transfection, the luciferase activity was measured. The data are presented as means ± SD (N = 3). Statistical analysis was performed by one-way ANOVA followed by the Tukey’s multi comparisons test. g, h NSC-34 cells were infected with adenovirus encoding LacZ or mouse NEAT1_1 at an MOI of 1. Cells were also co-infected with adenovirus encoding LacZ or FLAG-PR100 at an MOI of 200 together with adenovirus encoding LacZ (−) or Cre-recombinase (+) at an MOI of 40. At 48 h after the infection, the quantitative real-time PCR analysis of NEAT1 was performed (g). The cell lysates were subjected to dot blotting analysis using indicated antibodies (h). The data are presented as means ± SD (N = 3). Statistical analysis was performed by one-way ANOVA followed by the Dunnett’s multi comparisons test. i, j NSC-34 cells were transfected with 0.2 μg/well of the pCMV-GFP or -mouse NEAT1_2 on 6-well plate. After the transfection, NSC-34 cells were infected with adenovirus encoding FLAG-PR100 at an MOI of 200. Total adenoviruses infected were adjusted at an MOI of 400 with adenovirus encoding LacZ. At 48 h after the infection, the quantitative real-time PCR analysis of NEAT1 was performed (i). The cell lysates were subjected to dot blotting analysis using indicated antibodies (j). The data are presented as means ± SD (N = 3). Statistical analysis was performed by one-way ANOVA followed by the Dunnett’s multi comparisons test. k, l NSC-34 cells were infected with adenovirus encoding LacZ or FLAG-PR100 at an MOI of 800. At 48 h after the infection, the quantitative real-time PCR analysis of NEAT1, Nfkb1, and Nr4a1 was performed (k). The cell lysates were subjected to dot blotting analysis using indicated antibodies (l). The data are presented as means ± SD (N = 3). Statistical analysis was performed by the unpaired t-test. m–o HeLa cells were infected with adenovirus encoding LacZ or FLAG-PR100 at an MOI of 800. At 48 h after the infection, the cell viability was detected by WST-8 assay (m). The cell lysates were subjected to dot blotting analysis using indicated antibodies (n). The quantitative real-time PCR analysis of NEAT1, CCL5, CXCL8, SH3PXD2A, and TSHZ2 was performed (o). The data are presented as means ± SD (N = 3). Statistical analysis was performed by the unpaired t-test

