Fig. 2.
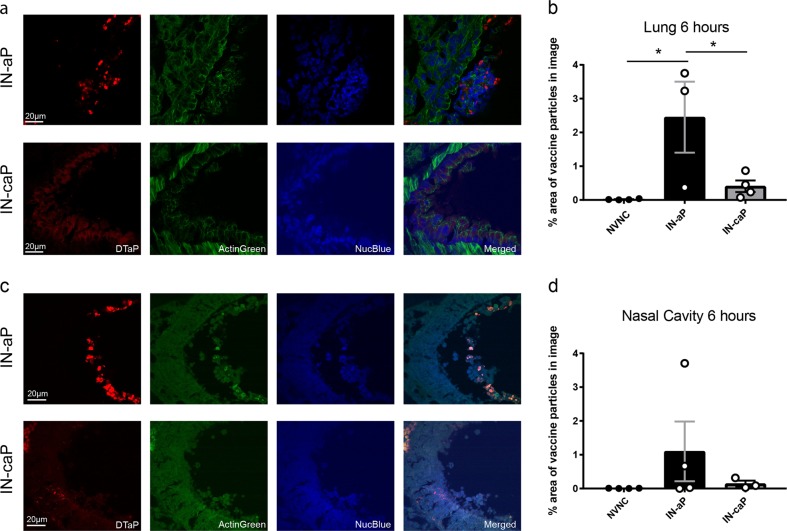
Acellular pertussis vaccine particle localization altered by curdlan adjuvant. a Representative images of flash frozen lung sections 6 h after immunization with IN-aP or IN-caP. Fluorescent particles were detected using a 660 laser, samples were counter-stained with NucBlue (blue) and ActinGreen (green). b Fluorescent DTaP particles were quantified by determining the percentage area of particles per field of view. (n = 3–4, with averages of three images per lung). Results are shown as mean ± SEM, *P < 0.05. c Representative images of paraffin embedded nasal cavity sections 6 h after immunization with IN-aP or IN-caP. d Fluorescent DTaP particles quantified by determining the percentage area of particles per field of view. (n = 3–4, with averages of three images per lung). P values were determined by one-way ANOVA with Tukey’s post hoc test

