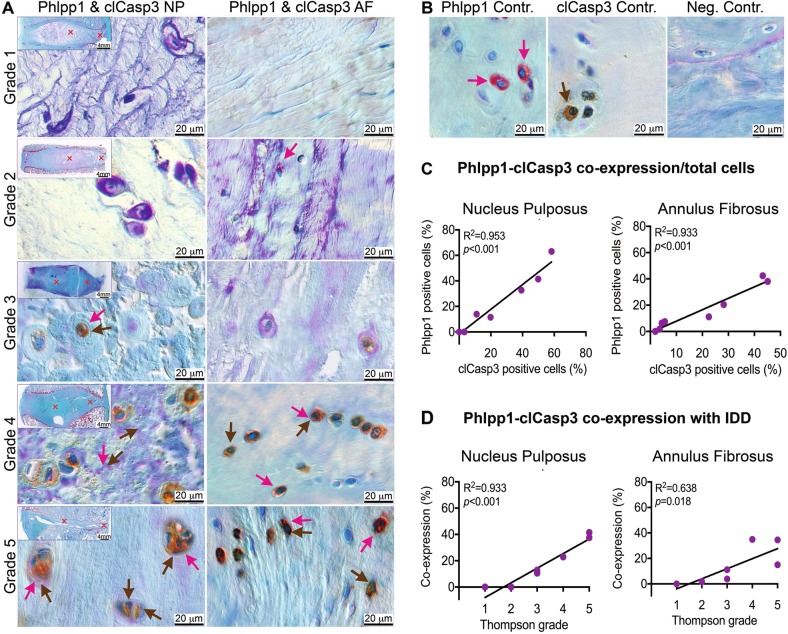
Fig. 3. Phlpp1 and clCasp3 are often co-expressed and increased with IVD degeneration.
a) Representative DIC images for the co-expression of Phlpp1 (red) with clCasp (brown). Red and brown arrows indicate positive cells for Phlpp1 and clCasp3, respectively. DIC: differential interference contrast. b Single positive stain for Phlpp1 (red) and clCasp3 (brown). Neg.: negative control of Phlpp1 stain with primary antibody being replaced by negative control IgG. c+d Quantification of Phlpp1-clCasp co-expression and its correlation with degeneration grade (n = 8). Phlpp1 was strongly correlated with clCasp3 expression both in the NP and AF. Their co-expression was positively correlated with the degeneration grade in the NP, and to a lesser extent in the AF

