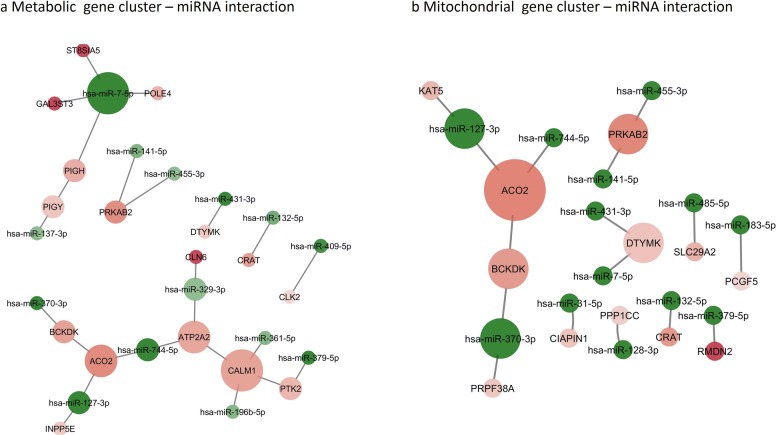
Fig. 3.
miRNA-target interaction network of oncocytoma on “Metabolic” gene cluster (a) and “Mitochondrial” gene cluster (b). Node size indicates interaction number, node color shades indicates expression (green: significant downregulation, red: significant upregulation; bright color represents higher fold change, faint color represents lower fold change) (Color figure online)

