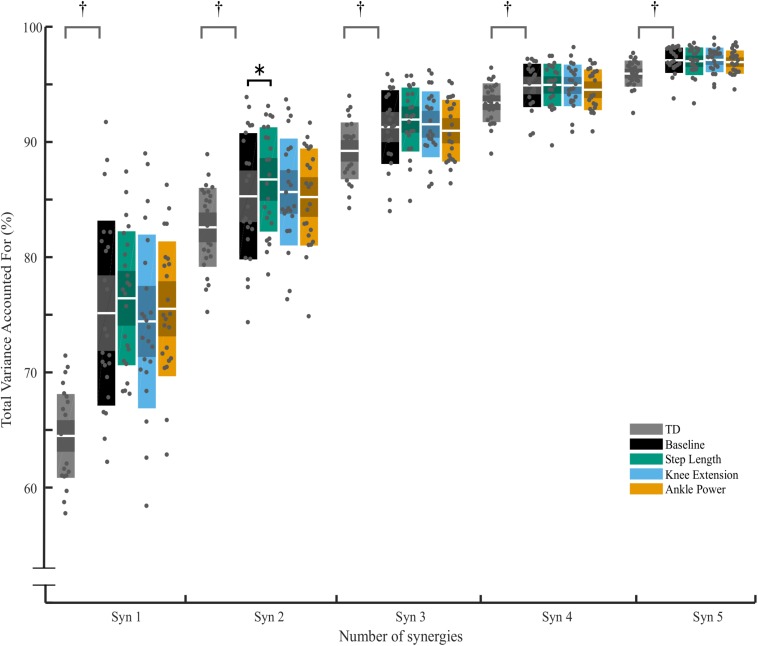
FIGURE 4.
Total variance accounted for (tVAF) from one to five synergy solutions for typically developing children (TD) and for children with CP across biofeedback trials. For each cluster, individual scores are plotted with dots, white middle bar shows mean, shading shows 95% CI, while solid color represents SD. † represents significant difference between TD and CP group (p < 0.05, independent t-test). ∗ Significant effect of biofeedback was found in tVAF2 (p = 0.046, post hoc RM-ANOVA). No further significant differences between baseline and any of the biofeedback conditions were found (p > 0.05).

