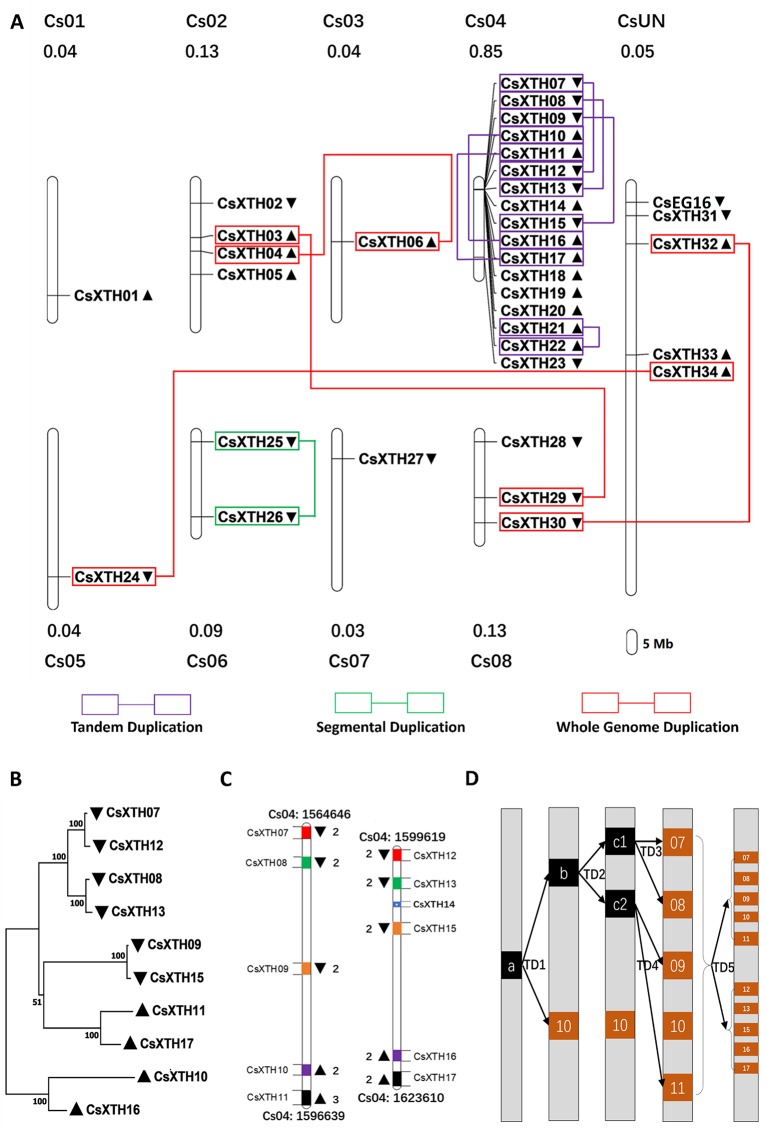
Figure 2.
Chromosomal loci and duplications hot spots of CsXTH genes. (A) Chromosomal locations and duplications of CsXTH and CsEG16 genes. The map was visualized by MapChart 2.1, and the concentration of CsXTH genes (number of CsXTHs per Mb) are written above each chart. Gene orientations are shown in nearby triangles. (B) Maximum-likelihood phylogeny of duplicated CsXTH genes on chromosome 4 (MEGA 7, bootstrap = 500). (C) Comparison of two duplicated segments. Gene sizes and intervals are to scale. Start and stop positions of the duplicated segments were written on the top and bottom of the segments. Gene orientations are shown with triangles on the left and right. Homologous genes are shown in the same color on the two duplicated segments. (D) Model for the evolutionary history of the two duplicated segments. a, b, and c represent ancestral genes during the evolution process. 07–17 represent CsXTH07–CsXTH17, respectively.

